
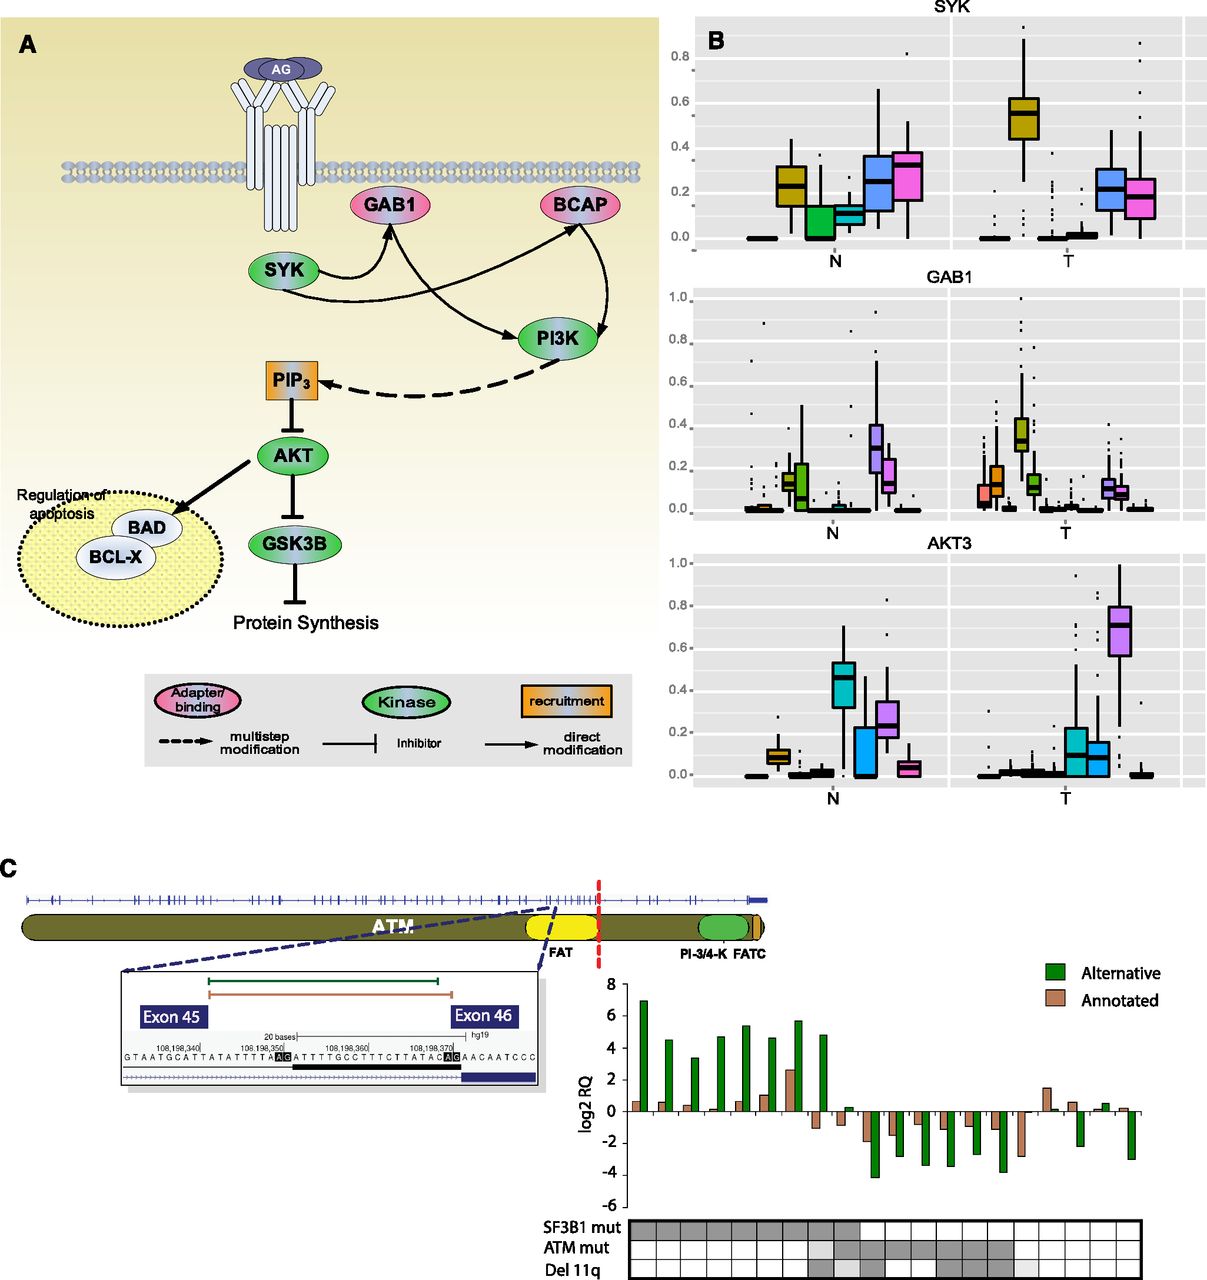
Splicing changes in the BCR pathway between normal (N) and tumor (T) samples. (A) Partial view of the BCR signaling pathway with representation of genes with significant changes in alternative splicing. (B) Distribution of alternative splicing ratios between tumor and normal samples for three example genes in the BCR pathway highlighted in A. (C) ATM splicing in SF3B1-mutated samples. (Top left) Location of CLL-specific novel splice junction in the ATM gene. The novel 3′ splice site extends 20 bp upstream into the intron. Red dashed line indicates the truncation of the C-terminal end of ATM caused by the frame shift introduced by the novel splice site. (Bottom right) Expression levels of the putative and annotated junctions analyzed by qPCR. The log2 scale of the relative gene expression is represented for cases with SF3B1 mutation (dark gray), cases with ATM mutation and/or 11q deletion (dark gray), and cases without these genetic alterations. Light gray indicates unknown status.


