
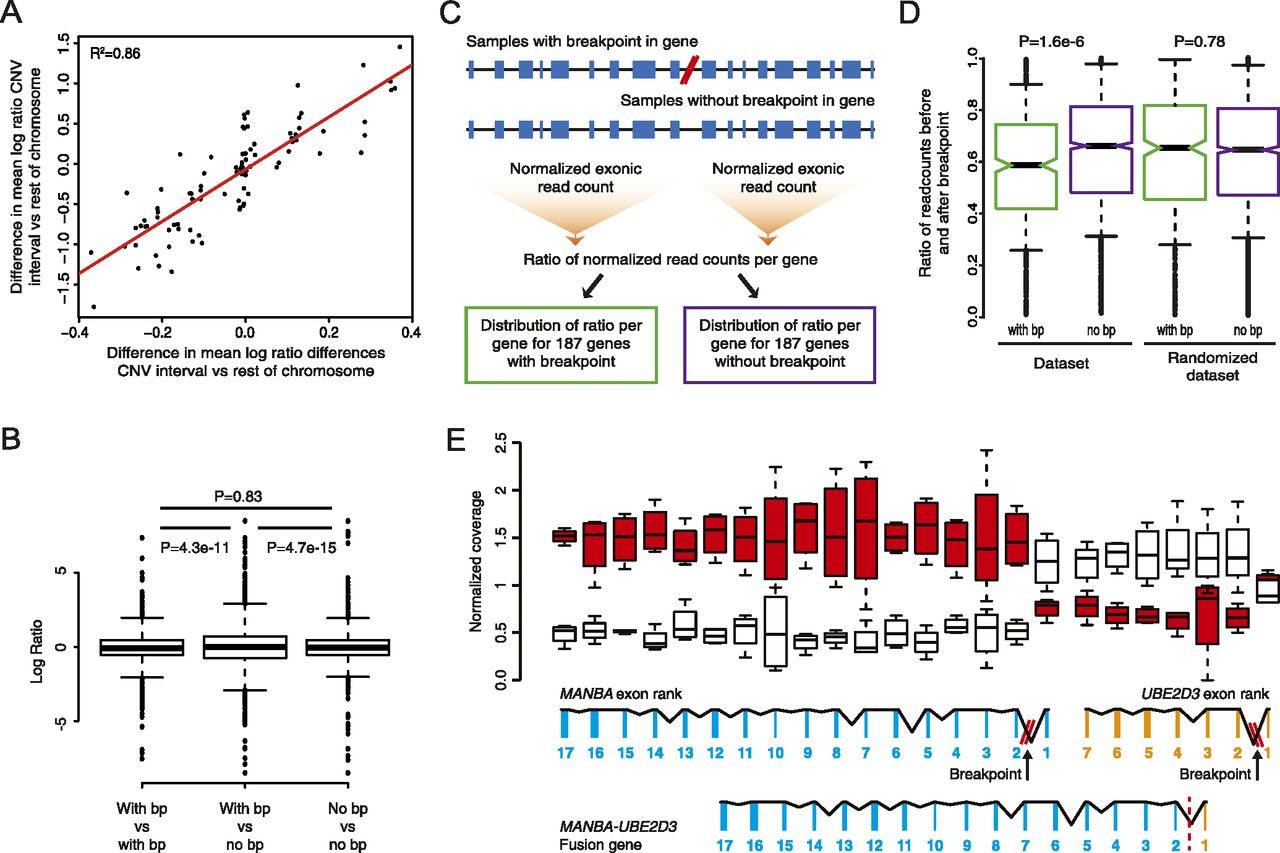
Intra-tumor differences in gene expression resulting from genomic rearrangements in patient 1. (A) Pairwise comparison of copy number changes and gene expression changes. (B) Boxplot showing log ratios derived from pairwise comparisons of patient 1 samples, categorized in three bins: (1) Both samples have a breakpoint, (2) one sample has the breakpoint and the other does not have the breakpoint, (3) both samples do not have a breakpoint. Statistical testing of differences in variance was performed using Levene’s test. (C) Schematic representation of a method used to detect expression differences of exons before and after a breakpoint in a gene. Per gene, the ratio of the normalized exonic read count before and after the breakpoint was determined for each of the samples from patient 1. Ratios were separated in two bins: one containing ratios derived from genes with a breakpoint and one containing ratios derived from genes without a breakpoint. (D) Boxplot of the distribution of ratios of the normalized exonic read count before and after a breakpoint for genes that contain a breakpoint (with bp) and genes that do not contain a breakpoint (no bp). The analysis was repeated by randomly assigning breakpoints to samples (randomized data set). Statistical testing was performed using a Mann-Whitney U-test. (E) Changes in gene expression for the exons of the MANBA and UBE2D3 gene exons in patient 1. In the presence of the deletion breakpoint a MANBA–UBE2D3 fusion gene is formed. (Red) Breakpoint present; (white) no breakpoint present.


