
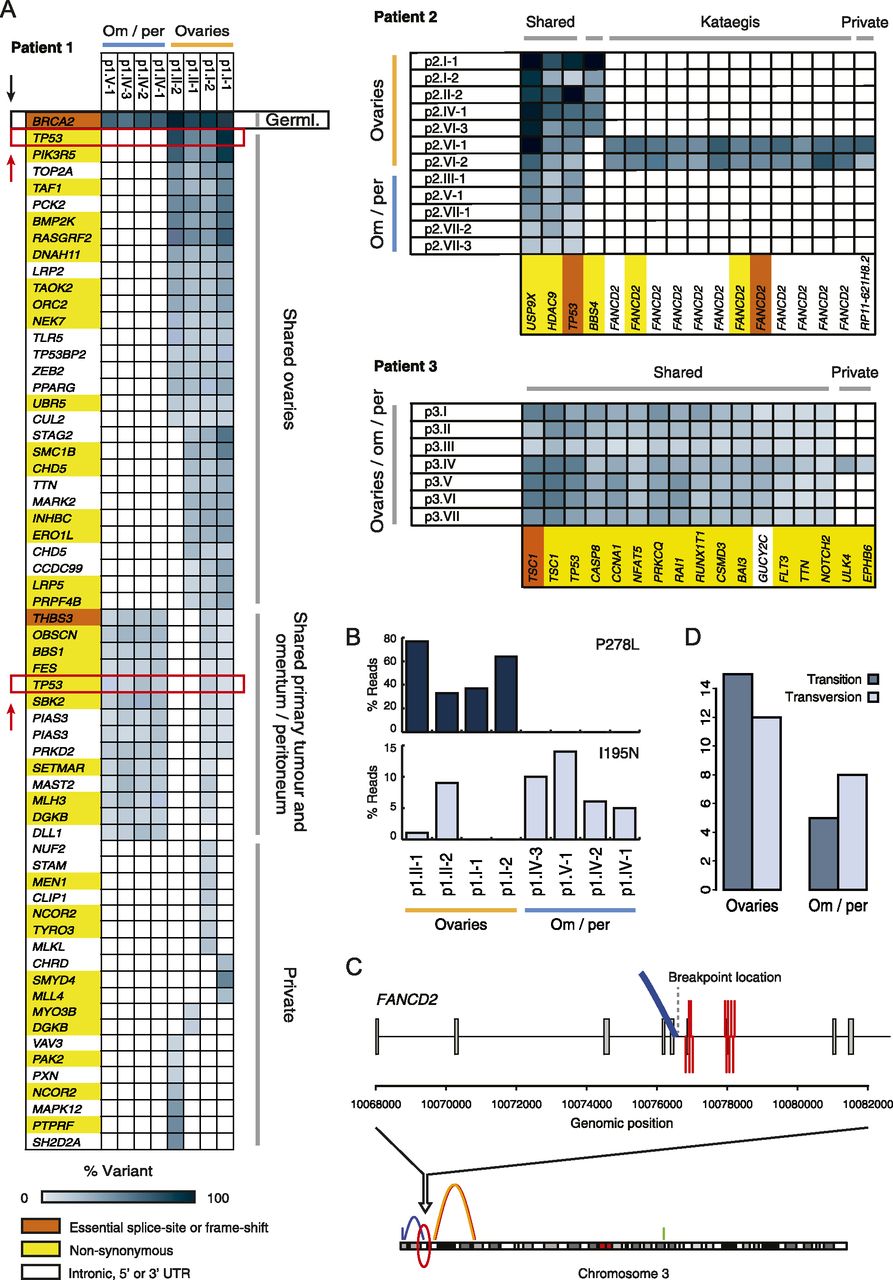
Somatic single-nucleotide mutation analysis results for patients 1, 2, and 3. (A) Regional distribution of mutations across tumor samples per patient. Blue gradient indicates the percentage of reads that carried the mutation. Gene colors indicate mutation impact: high, essential splice site or frame-shift (orange); medium, nonsynonymous (yellow); or silent, intronic, 5′ or 3′ UTR (white). (B) Distribution of the two TP53 missense mutations detected in patient 1 (P278L and I195N) across all tumor samples of this patient. (C) Kataegis as detected in patient 2 samples p2.VI-1 and p1.VI-2. The 12 single-nucleotide changes in FANCD2 coincide with a genomic breakpoint, which is solely detected in these samples. (D) Transitions versus transversions for patient 1. All ovarian samples (primary tumor [p1.I-1 and p1.I-2] and metastases located in the other ovary [p1.II-1 and p1.II-2]) versus the omentum/peritoneum metastases (p1.IV-1, p1.IV-2, p1.IV-3, and p1.V-1).


