
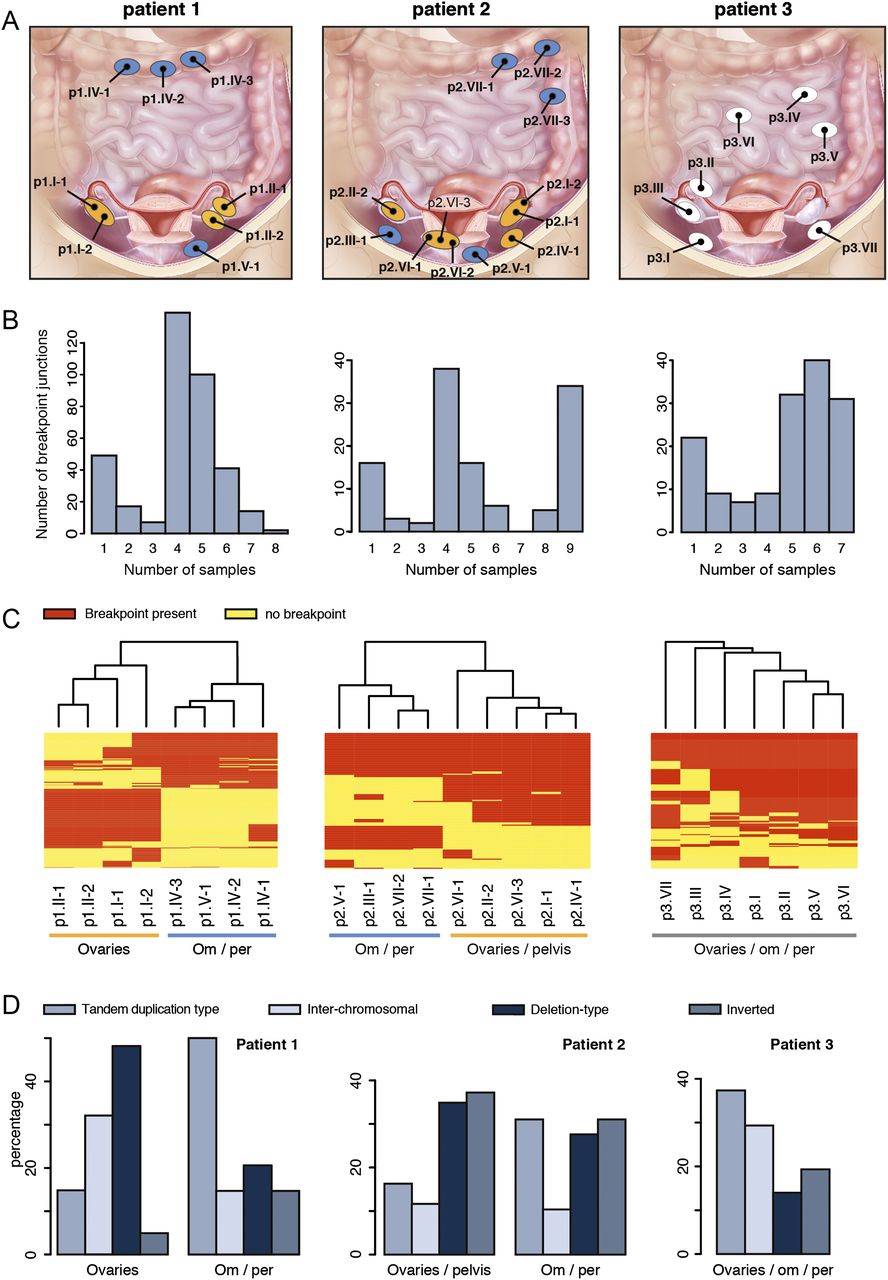
Somatic genomic rearrangements detected in patient 1 (left), 2 (middle), and 3 (right). (A) Biopsy locations per patient. Ellipses indicate physically separated tumors; black dots represent biopsy locations. Ellipses are not indicative for tumor size. For patients 1 and 2, ellipses are colored according to the corresponding branch derived from the SV analysis (see panel C). Patient 1: ovaries (orange), om/per (blue). Patient 2: ovaries/pelvis (orange), om/per (blue). (Illustration © 2010 Terese Winslow, U.S. Govt. has certain rights.) (B) Bar chart representing the distribution of the frequency of breakpoints per patient. (C) Heat map and clustering analysis of the detected somatic breakpoints per patient. Rows represent breakpoints, red and yellow bars indicate the presence (red) or absence (yellow) of the breakpoint in a sample. Om/per, omentum/peritoneum. (D) Distribution of somatic rearrangement types per branch for patients 1 and 2 and for all patient 3 samples.


