
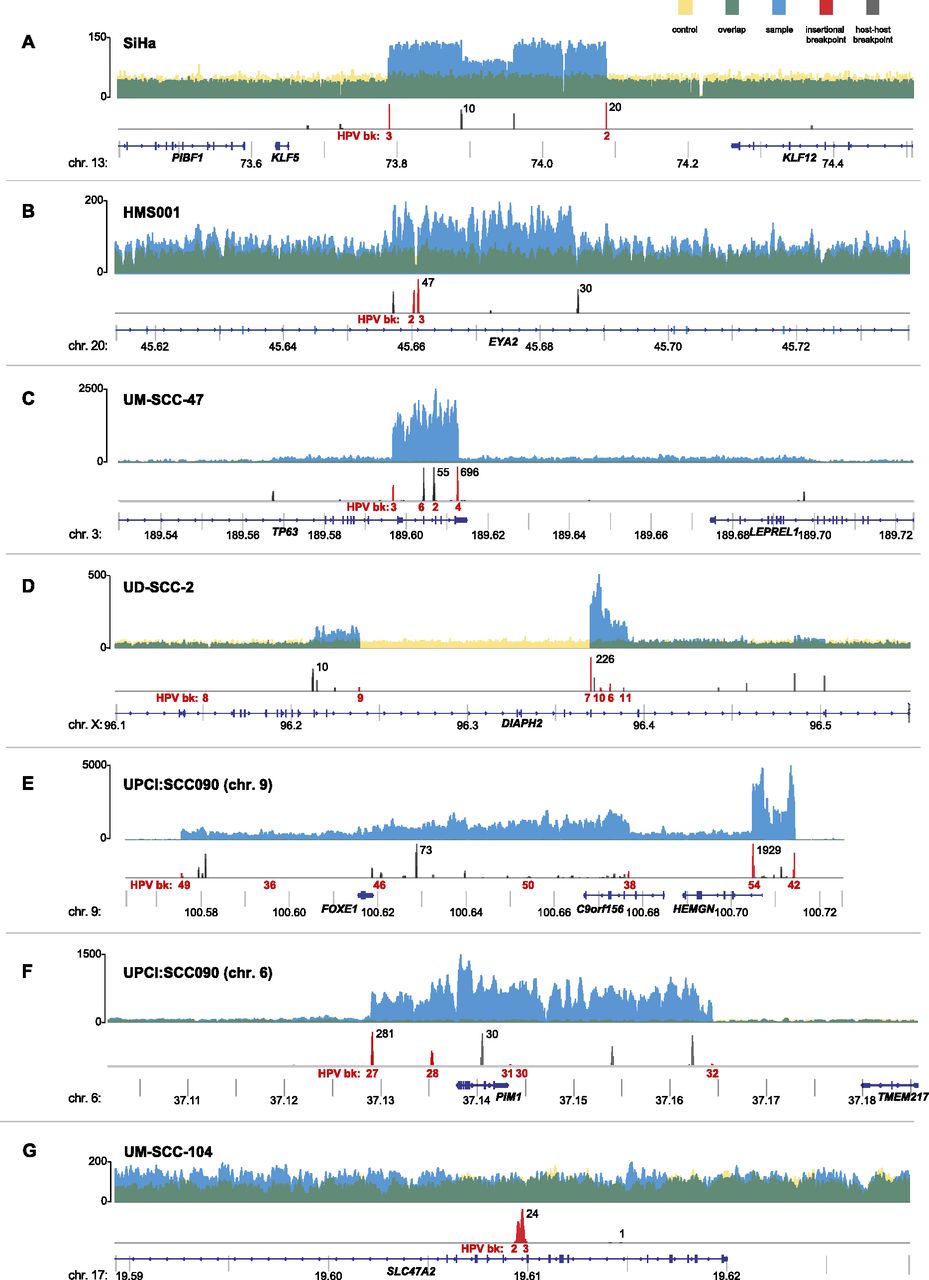
Focal CNVs and breakpoints adjacent to HPV insertions. Histograms showing the depth of WGS coverage (y-axis) of well-aligned (top; yellow, blue, and green) and breakpoint sequence reads (bottom; red and gray), mapped to the reference human genome (hg19) at indicated chromosomal loci (x-axis, gene schematics, coordinates in megabases). (Top) Focal CNVs and (bottom) HPV insertional (red) or host–host (gray) breakpoints are shown for cancer samples (A) SiHa; (B) HMS001; (C) UM-SCC-47; (D) UD-SCC2; (E) UPCI:SCC090, chromosome 9; (F) UPCI:SCC090, chromosome 6; and (G) UM-SCC-104. (Top, y-axis labels) The depth of WGS coverage is shown for cancer samples (blue); normal control (yellow); overlapping, shared coverage regions (green). (Bottom) Maximal breakpoint read counts (black) and breakpoint ID numbers (HPV bk, red).


