
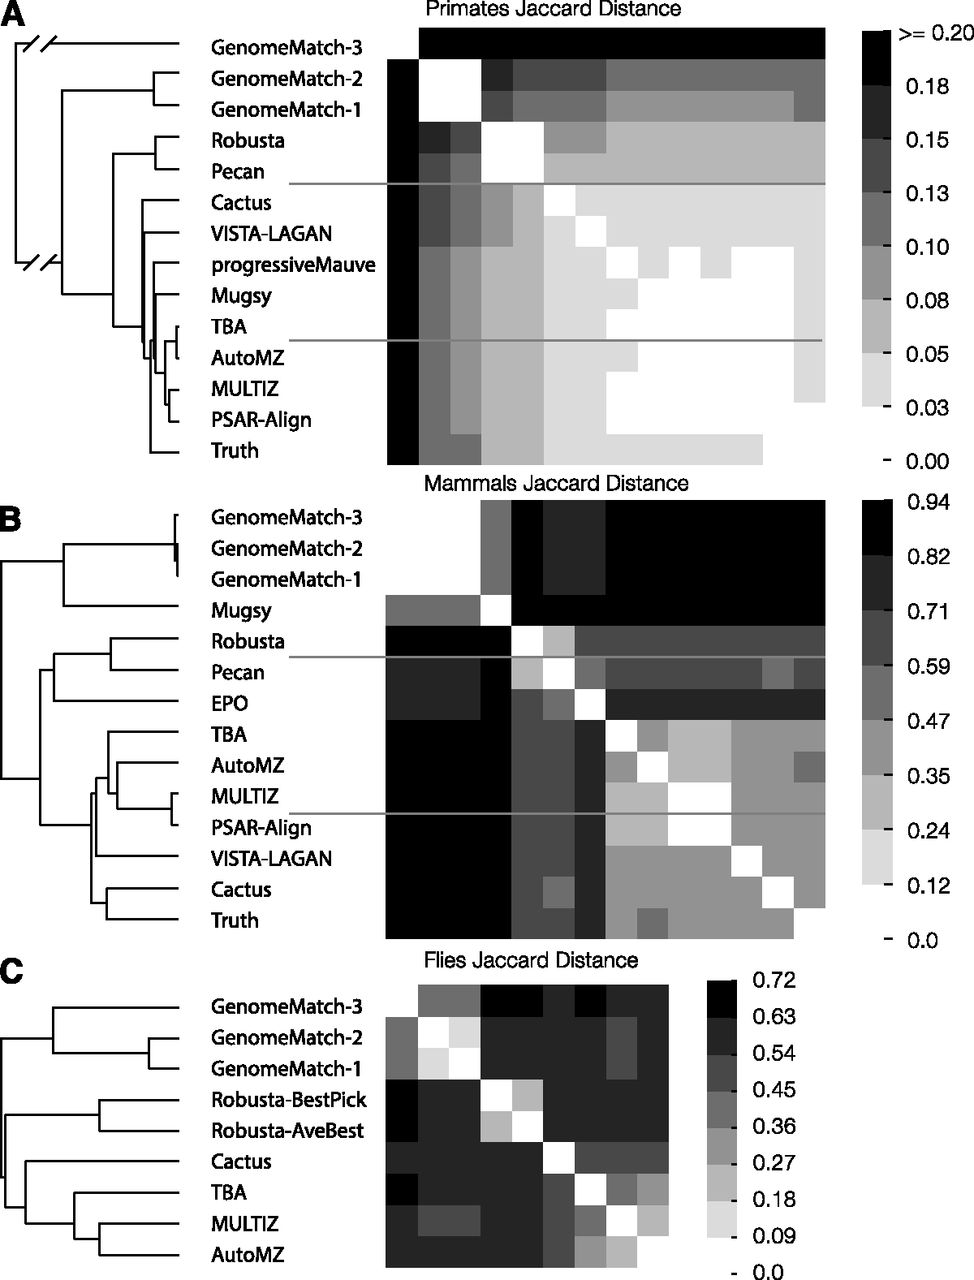
Figure 8.
The Jaccard distance (1 − Jaccard similarity coefficient) matrix and accompanying hierarchical clustering (UPGMA) of submissions for each of the three test sets. (A) Primate Jaccard distance; (B) mammal Jaccard distance; (C) fly Jaccard distance. Higher values indicate that the sets of aligned pairs of two submissions are more dissimilar, and lower values indicate similarity.


