
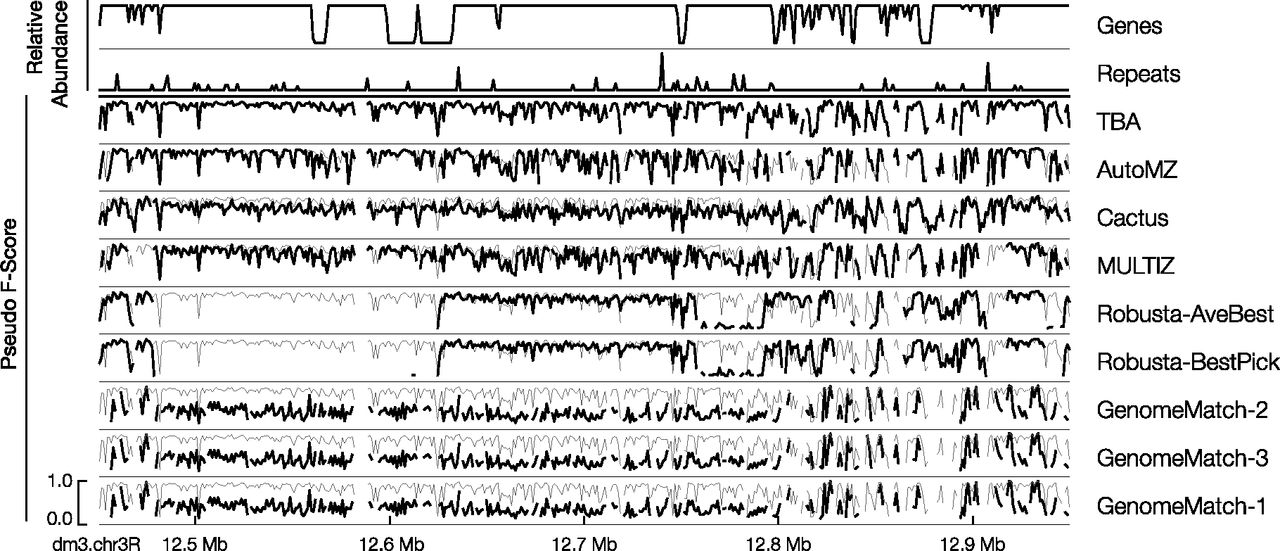
Region 2 of D. melanogaster (dm3) with respect to D. grimshawi (droGri2) of the regional analysis of the mammal simulation data set. Region 2 is defined as bases 12,450,223–12,950,222 of dm3 chromosome 3R (horizontal axis). Rows are as follows: the relative abundance of genes within the region; the relative abundance of repetitive sequence in the region; and submissions in descending order of average pseudo F-score. Each submission row shows the pseudo F-score of the submission in black. The vertical axis of each row uses the same scale as shown in the bottom row. The pseudo F-score value of the top submission for this region (TBA) is shown in gray in the background.


