
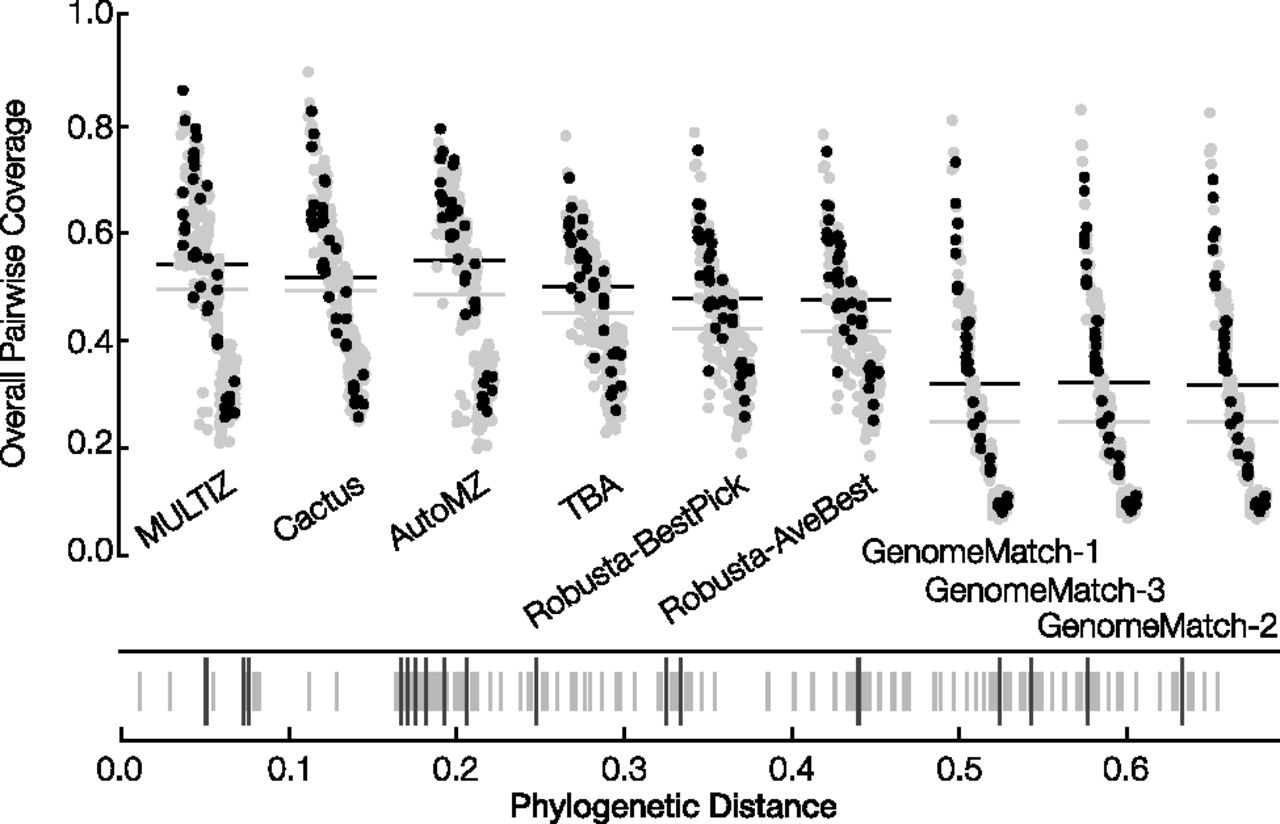
Figure 6.
Overall pairwise coverage values in the fly data set. Submissions are ordered left to right (descending) by overall coverage. Gray points are nonreference pairs, and black points contain the reference. The horizontal gray line shows the average coverage of the submission for all points, and the horizontal black line shows the average coverage of the submission just for pairs containing the reference. Beneath the pairwise coverage plot is a barcode plot showing the phylogenetic distances of all pairs. Shorter gray lines are nonreference pairs and longer black lines are reference-containing pairs.


