
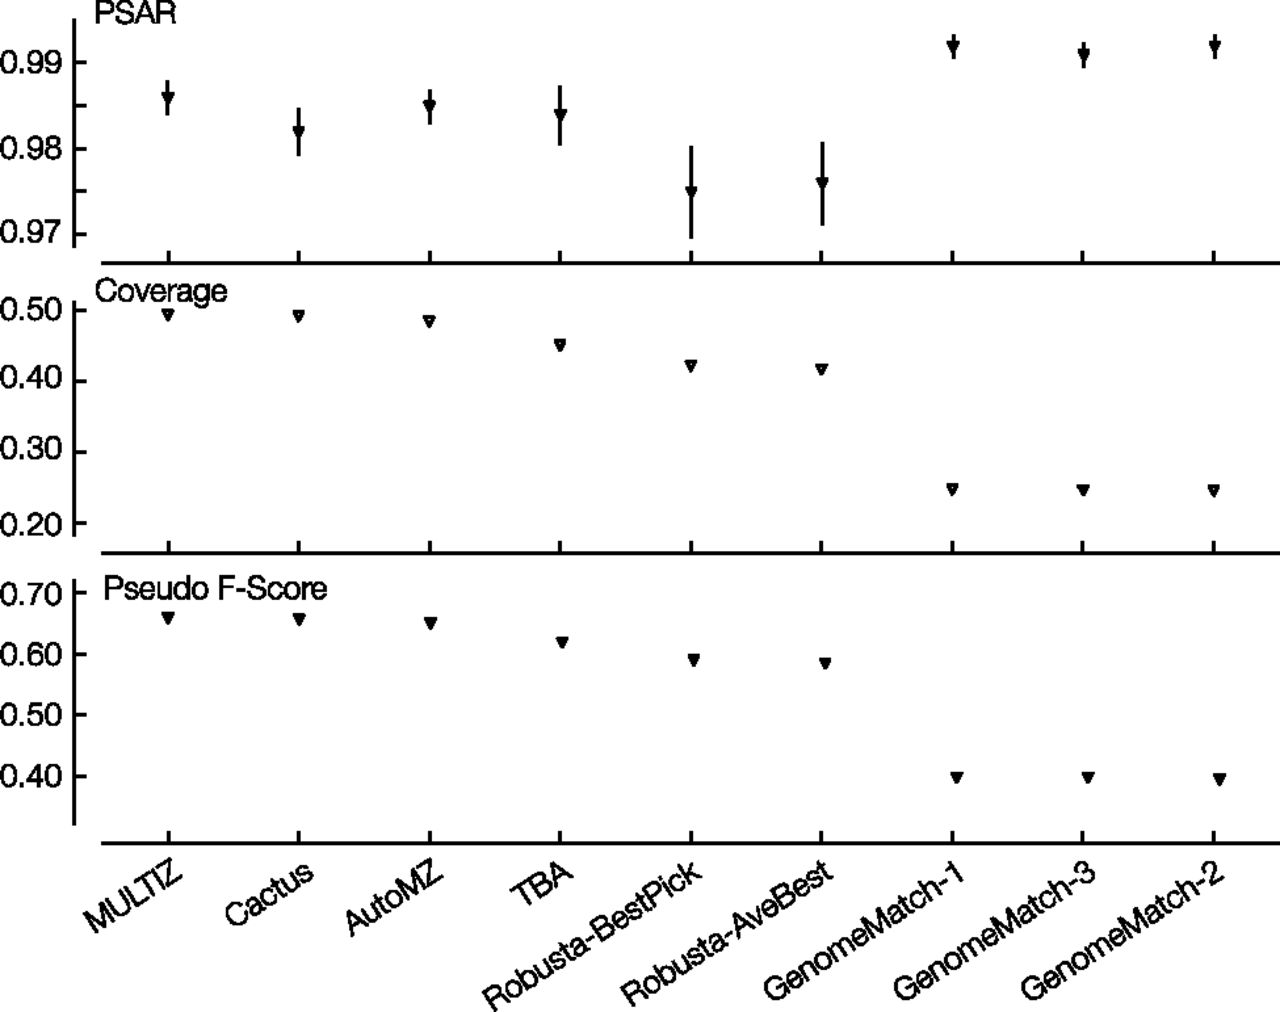
Figure 5.
Fly results: values of PSAR-precision; average overall coverage between all pairs; pseudo F-score. Columns are in descending order of mean pseudo F-score value. For each metric, each submission is made up of a downward triangle with a vertical line representing the regional mean ± SD.


