
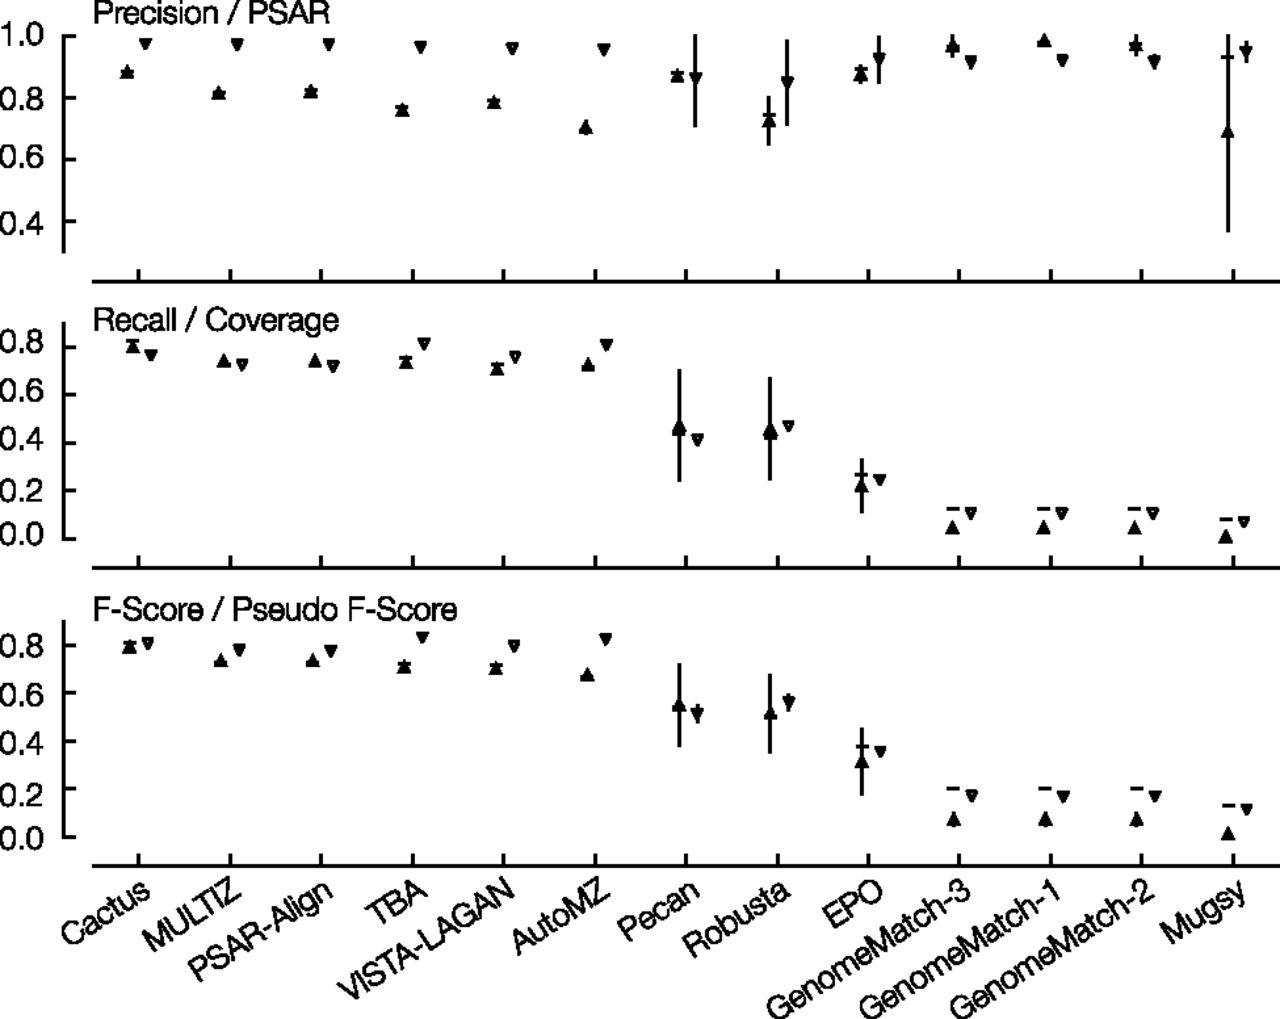
Simulated mammal results comparing simulation values to statistical values. Shown are precision and PSAR; recall and coverage; F-score and pseudo F-score. Each column represents the results of one submission; columns are in descending order of overall (full genome) F-score value. The horizontal line is, respectively, the overall precision, recall, or F-score value; the upward triangle with a vertical line is the regional precision, recall, or F-score mean value, ± the regional standard deviation; the downward triangle with a vertical line is the PSAR-precision, coverage, or pseudo F-score mean value, ± standard deviation for values that were computed using regional subalignments.


