
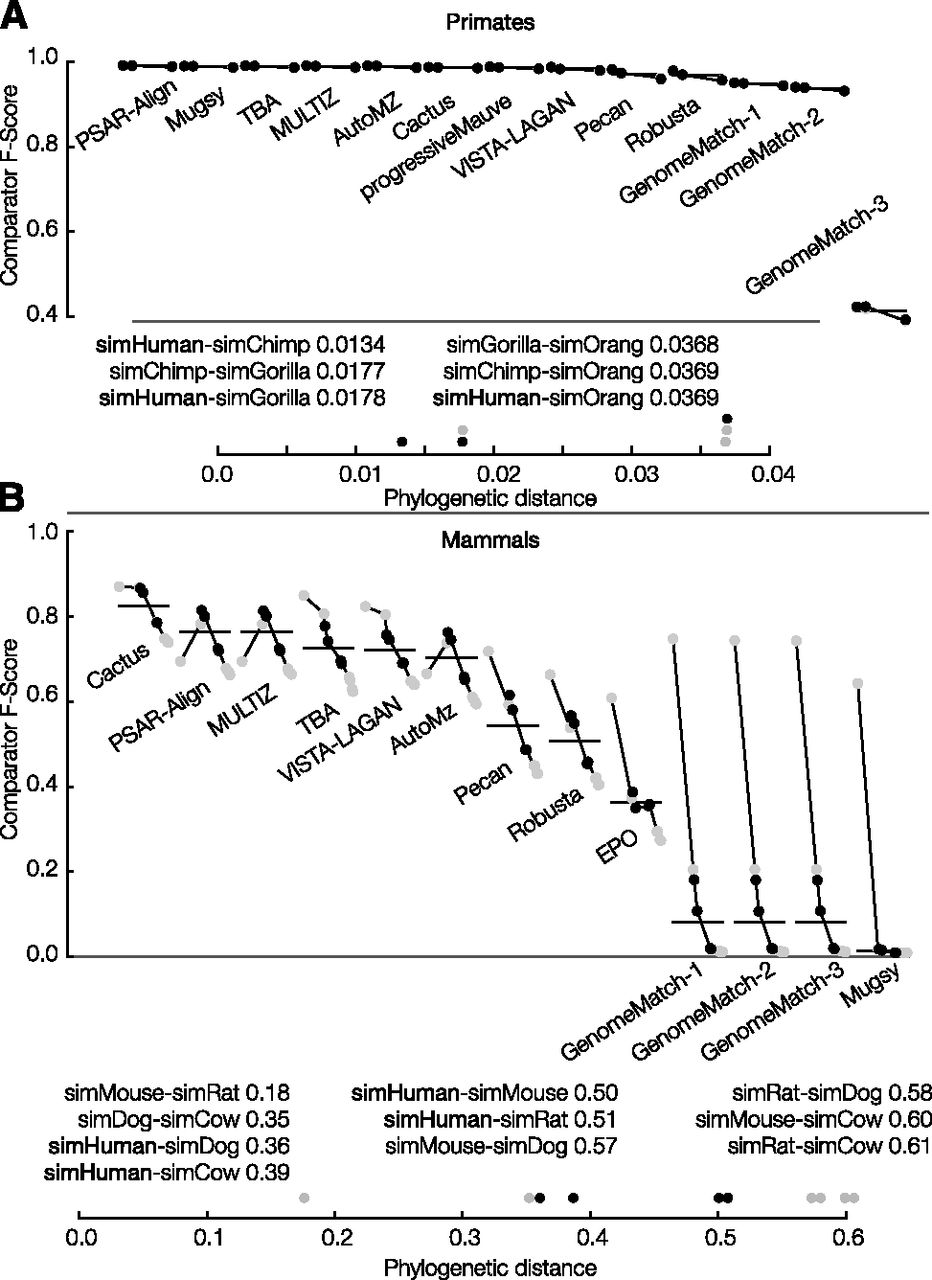
Primate (A) and mammal (B) simulation F-score results stratified by phylogenetic distance. For each subplot, the vertical axis shows the F-score and the horizontal axis shows 13 individual submissions ordered from left to right (descending) by average overall F-score. Horizontal gray lines show the overall F-score of the submission, taking into account all sequence pairs. Horizontal black lines show the overall F-score of the submission, taking into account only sequence pairs including the reference. Submissions are comprised of points connected by a line where the points are in ascending order of phylogenetic distance (all possible pairs are shown).


