
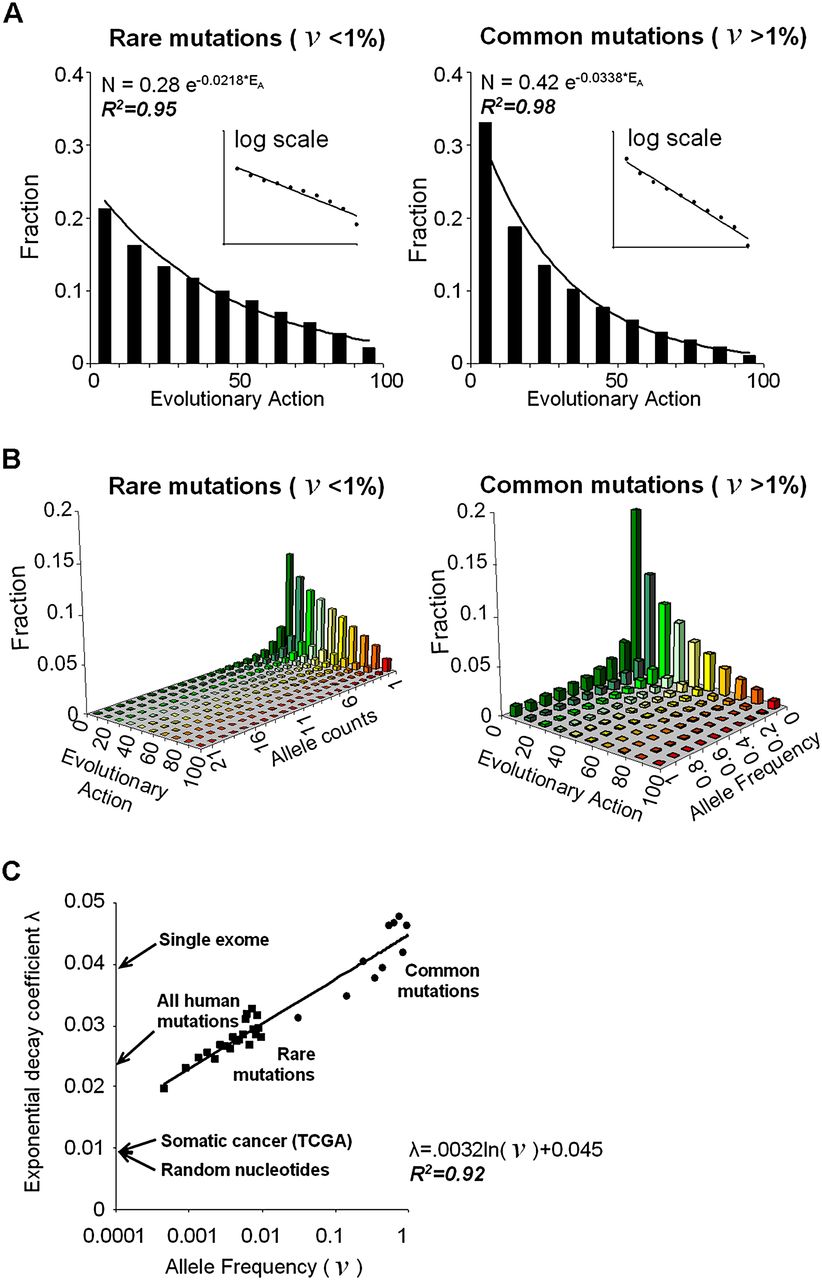
Nearly exponential action distributions of human coding polymorphisms. (A) Coding polymorphisms from the 1000 Genomes Project (including 1092 individuals) were separated into 225,751 rare variants (left) and 36,354 common mutations (right), based on an allele frequency (ν) threshold of 1%. Both groups fit exponential distributions with Pearson coefficients R2 of 0.95 and 0.98 and decay rates of 2.18 × 10⁻² and 3.38 × 10⁻², respectively, when binned into action deciles. The insets show equivalent log-linear plots. (B) These groups were further fractionated by allele count or frequency. The action distribution of polymorphisms in the same tranche of allele count, or frequency, also fit an exponential with R2 values from 0.87 to 0.99. The colors represent different Evolutionary Action (green for low and red for high). (C) The action decay rate for these exponentials varies linearly with the logarithm of their allele frequency (R2 value of 0.92). Arrows indicate the observed decay rates for all nonsynonymous coding mutations from a single individual’s exome; for the rare and the common mutations of the 1000 Genomes Project; for somatic cancer mutations retrieved from TCGA (http://tcga-data.nci.nih.gov); and for nonsynonymous mutations obtained by the translation of random nucleotide changes following the standard genetic code (random nucleotides).


