
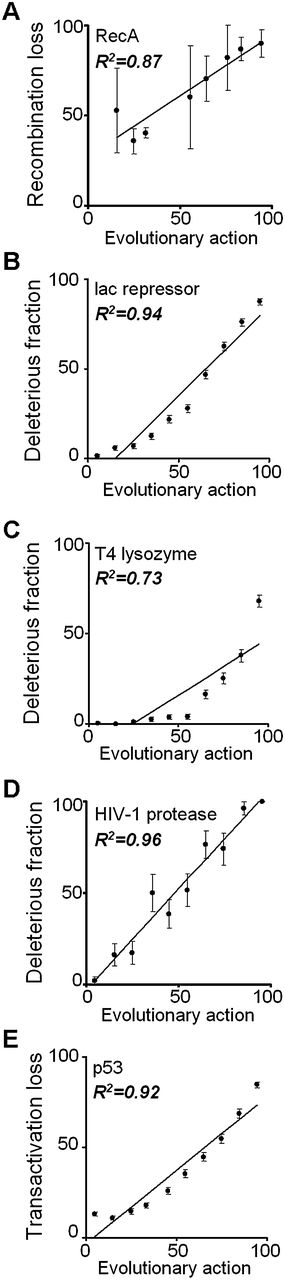
Mutational action correlates with experimental impact. Each panel shows along the x-axis the action predicted from Equation (2) and along the y-axis the fractional activity or fitness measured experimentally as (A) the average loss of recombination activity in 31 point mutants of E. coli RecA protein; (B) the nonfunctional fraction of 4041 point mutants in E. coli lac repressor in a β-galactosidase repression assay (Markiewicz et al. 1994); (C) the nonfunctional fraction of 2015 point mutants in bacteriophage T4 lysozyme in a plaque formation assay (Rennell et al. 1991); (D) the nonfunctional fraction of 336 HIV-1 protease point mutants in substrate cleavage (Loeb et al. 1989); and (E) the average transactivation activity of 2314 human TP53 point mutants assayed in yeast over eight response-elements (Petitjean et al. 2007). The data are binned into action deciles, the R2 values indicate Pearson product-moment correlation coefficients following linear fitting, and the standard error of the mean is shown with error bars.


