
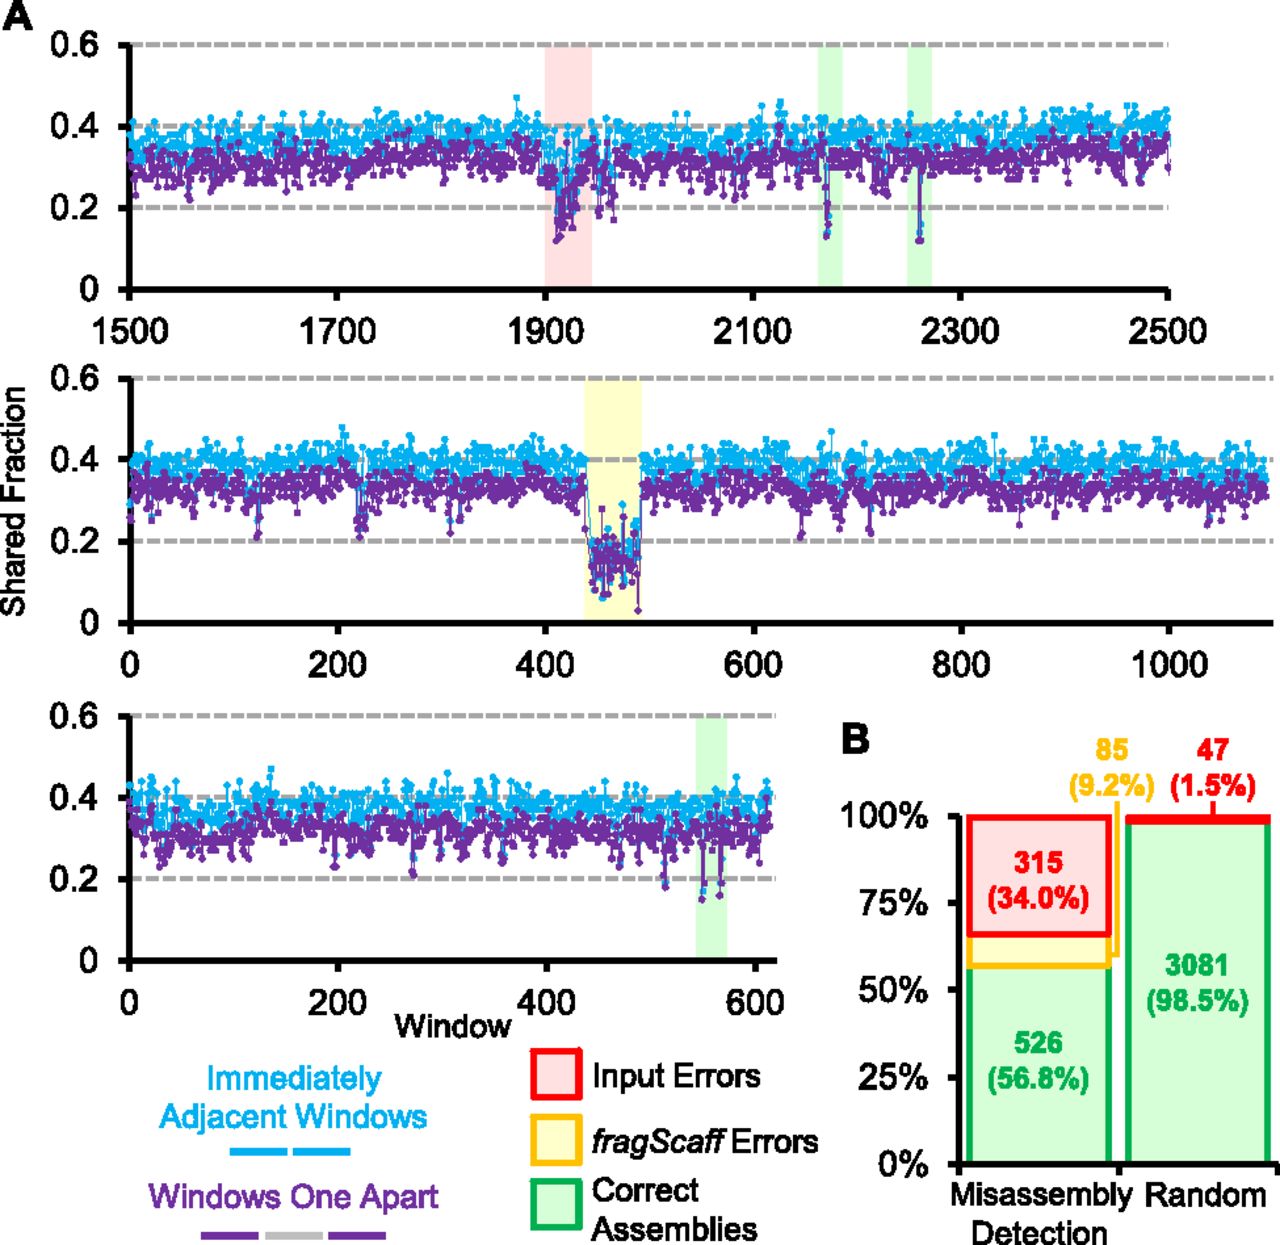
Misassembly detection using CPT-seq. (A) Three regions of assembled scaffolds representing various misassembly detections are shown. For each region, the set of CPT-seq indexed pools that cover each 5-kbp window (x-axis) was determined. The shared fraction of indexed pools between immediately adjacent windows (blue) and for windows one apart (purple) is plotted. Subregions for which both shared fraction values were in the bottom fifth percentile overall were called as potential misassemblies. False positive misassembly calls (i.e., no misassembly is actually present) overwhelmingly consisted of an isolated window (green shading), whereas multiple consecutive windows with low shared fraction values corresponded to misassemblies by fragScaff (yellow shading) or in the initial input assembly (red shading). (B) Breakdown of regions called as potentially misassembled by this approach (left) versus a randomly selected set of windows for comparison (right).


