
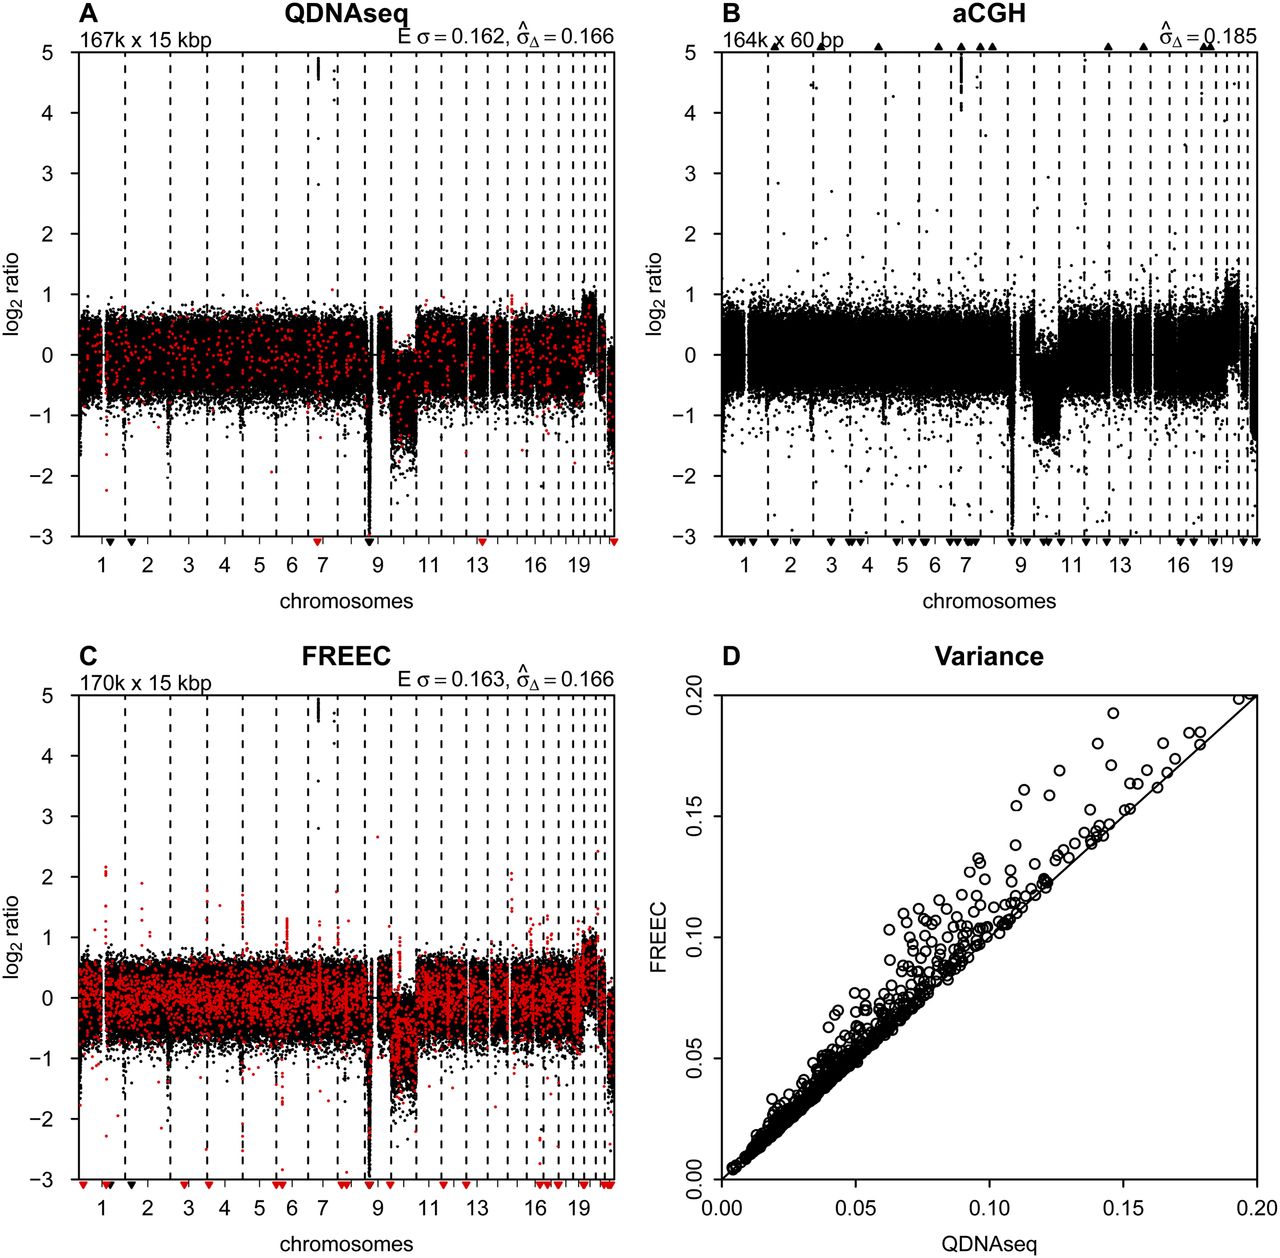
Comparison to other methods. (A) Final copy number profile of sample LGG150 obtained with QDNAseq after removing blacklisted bins and correcting read counts
for GC content and mappability. This procedure results in 166,909 bins, and highlighted in red are those 750 bins that are
not contained in the output of FREEC. (B) Copy number profile of sample LGG150 obtained with an Agilent 180K microarray with 164,378 unique array elements. (C) Copy number profile of sample LGG150 obtained with FREEC with 170,474 bins. Highlighted in red are those 4315 bins that
are not contained in the output of QDNAseq. Note that many of the red bins are in focal peaks that have the potential of being
called aberrations but which are probably spurious since they are contained in the QDNAseq blacklists. (D) Noise  for QDNAseq versus FREEC calculated from the thousand samples in Figure 3B. Only the 166,159 bins present in the output of both algorithms were used in order to eliminate differences caused by blacklisting
spurious bins.
for QDNAseq versus FREEC calculated from the thousand samples in Figure 3B. Only the 166,159 bins present in the output of both algorithms were used in order to eliminate differences caused by blacklisting
spurious bins.


