
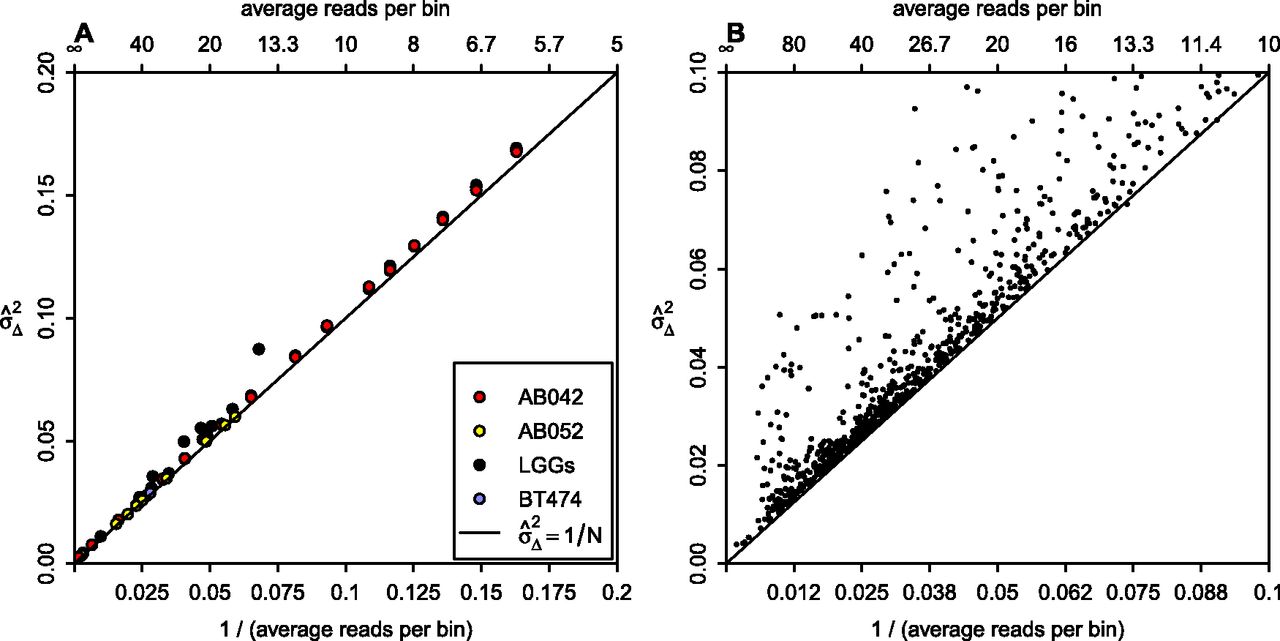
Dependence of variance on sequence depth. (A) The relationship between sequence depth and variance  for 15 LGGs (black), cell line BT474 (blue), 10 independent library preparations of SCC sample AB052 (yellow), and subsamplings
of AB042 data (red). All individual samples are within the left half of the graph, with the subsamplings extending to the right half as well. The black line shows the linear expectation of the variance as 1/N, where N is the average number of reads per bin. Lines fitted through the AB042 subsamplings and AB052 repeats have slopes of 1.026
and 1.003, and intercepts of 0.00107 and 0.000781, respectively. (B) The relationship between sequence depth and variance for more than a thousand samples sequenced at our institute.
for 15 LGGs (black), cell line BT474 (blue), 10 independent library preparations of SCC sample AB052 (yellow), and subsamplings
of AB042 data (red). All individual samples are within the left half of the graph, with the subsamplings extending to the right half as well. The black line shows the linear expectation of the variance as 1/N, where N is the average number of reads per bin. Lines fitted through the AB042 subsamplings and AB052 repeats have slopes of 1.026
and 1.003, and intercepts of 0.00107 and 0.000781, respectively. (B) The relationship between sequence depth and variance for more than a thousand samples sequenced at our institute.


