
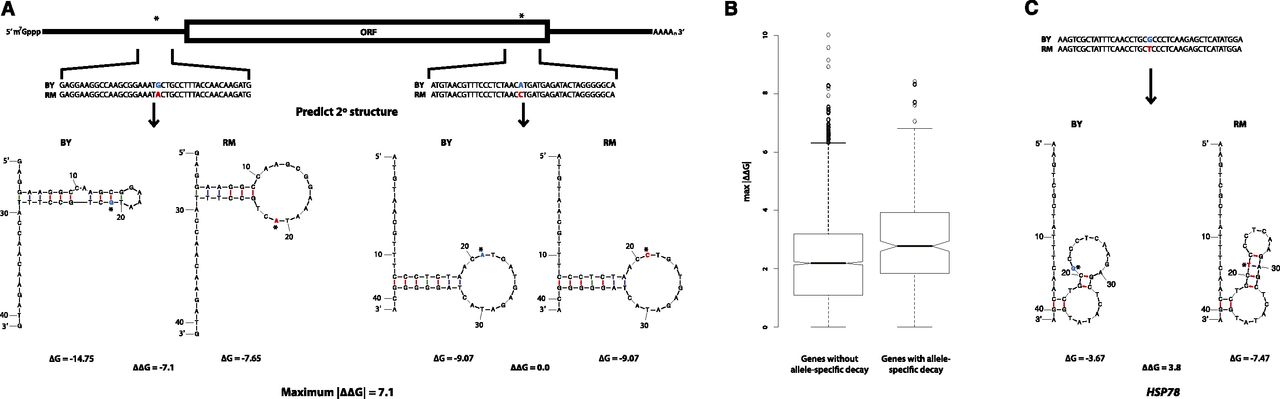
Genes with significant allele-specific decay are enriched for predicted differences in mRNA structure. (A) Calculation of ΔΔG for SNVs across a transcript. We determined the mRNA sequence for both the BY and RM alleles of each gene. For each SNV (denoted by *), we calculated the predicted minimum Gibb’s free energy (ΔG) associated with the mRNA secondary structures of each allele using 41-bp regions of the mRNA transcript centered on each of the SNVs. The difference in ΔG (ΔΔG) between the BY and RM alleles for each 41-bp window was measured by subtracting the ΔG calculated for the RM allele from the ΔG calculated for the BY allele. We then calculated the absolute value of the difference in free energy between alleles, |ΔΔG| = |ΔGBY – ΔGRM|, for each variant. For each gene, we recorded the maximum |ΔΔG| observed among all its variants. (B) The maximum |ΔΔG| of genes with and without allele-specific decay rate differences are significantly different (Mann-Whitney U test, P-value = 4.47 × 10⁻⁷), suggesting that genes with allele-specific decay rates are significantly enriched for variants with larger predicted effects on mRNA secondary structure compared to genes without allelic differences in decay. (C) Predicted mRNA secondary structures surrounding an SNV in the gene HSP78, which encodes a mitochondrial matrix chaperone. The location of the SNV in each transcript allele is denoted by *; the BY and RM alleles at the variant site are colored blue and red, respectively. Note, HSP78 only contains one SNV.


