
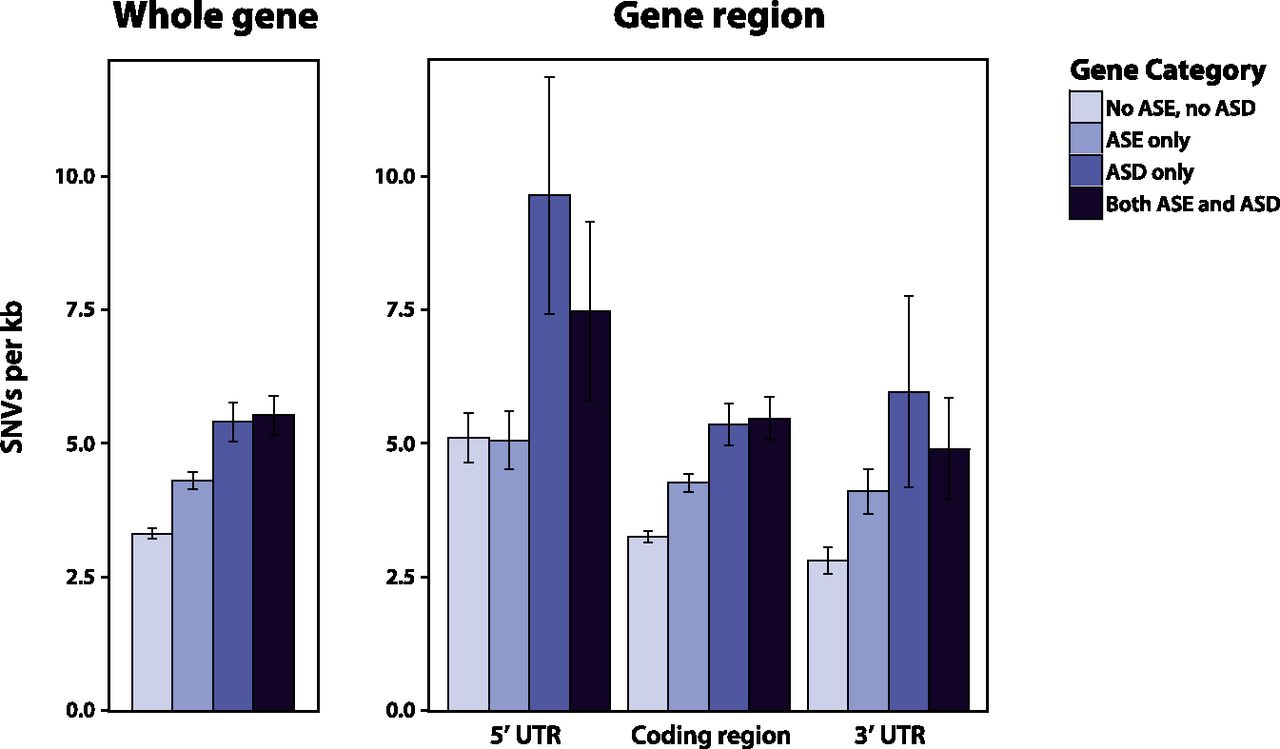
Figure 4.
Levels of genetic diversity in genes with and without allele-specific differences in mRNA decay rates and steady-state expression levels. Bar plots show the mean number of single nucleotide variants (SNVs) between BY and RM per kilobase across the whole gene (left) or across each gene region separately (right). Error bars correspond to the 95% confidence interval of the mean. ASE and ASD denote allele-specific expression and allele-specific decay, respectively.


