
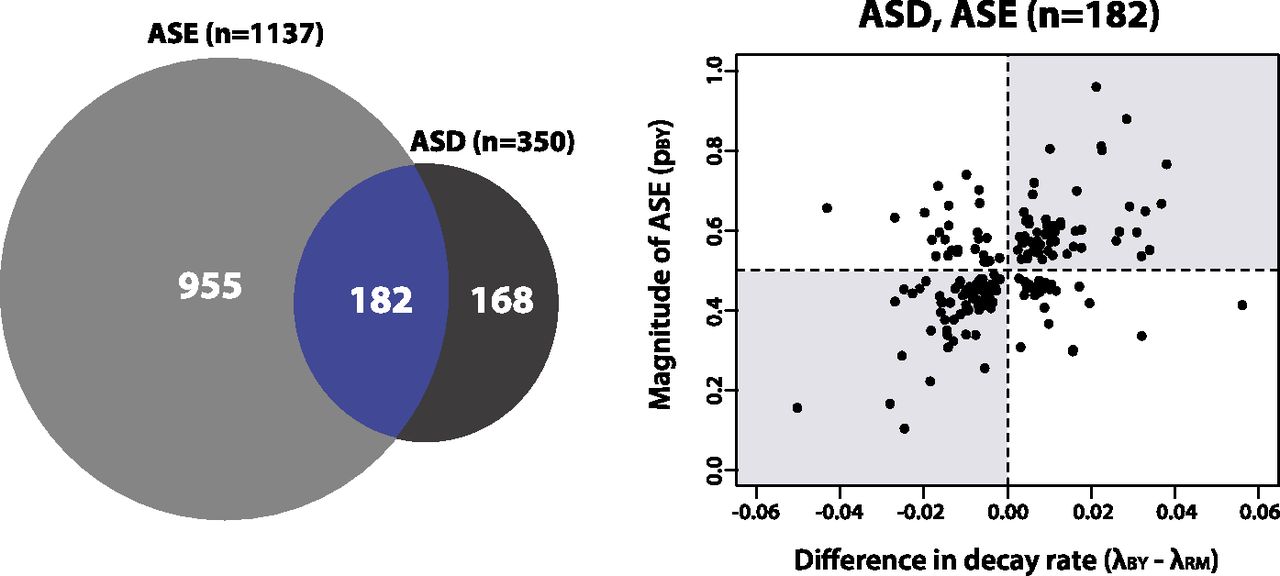
Figure 3.
mRNA decay rates in yeast are often coupled to opposite changes in transcription initiation. (Left) Venn diagram showing the overlap of genes with significant allelic differences in steady-state gene expression (ASE) and decay (ASD). (Right) Scatter plot showing estimates of differences in decay rates between BY and RM (x-axis) versus the proportion of transcripts from the BY allele (pBY) inferred from the 0-min time point for genes with both ASE and ASD. The shaded gray rectangles represent quadrants where magnitudes of ASD and ASE are discordant, suggesting compensatory evolution.


