
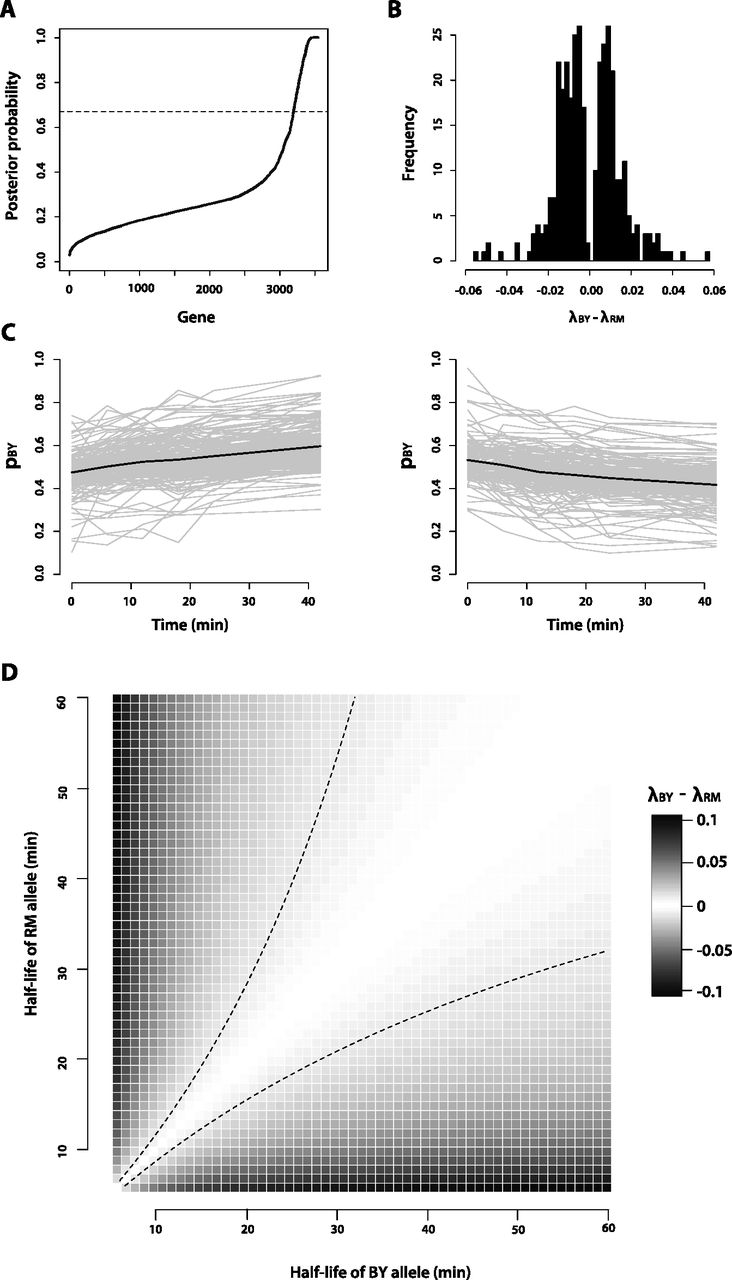
Characteristics of genes that exhibit allele-specific mRNA decay. (A) Posterior probability that a gene exhibits allele-specific mRNA decay rates, as calculated from our Bayesian hierarchical Markov chain Monte Carlo model. The dashed line at posterior probability = 0.67 corresponds to the threshold we used to call genes as exhibiting significant allele-specific mRNA decay rates. (B) Histogram of the slope calculated from the linear logistic model for the 350 genes with significant (FDR = 10%) allele-specific mRNA decay rates. The exponential of the slope, which estimates λBY – λRM, is the change in the odds of observing a BY mRNA allele given a 1-min increase in time. (C) Decay rate time courses of all genes in which the RM allele decays significantly faster than the BY allele (left) and the BY allele decays significantly faster than the RM allele (right). The gray lines represent the decay rate time courses of each of the individual genes. The black lines represent the mean decay rate time courses for all of the genes included in each plot. (D) Correspondence of λBY – λRM to half-life differences between the BY and RM alleles of a gene. The dashed black lines represent the positive and negative of the median effect size, where effect size is defined as |λBY – λRM|, observed among the genes we identified with significant allele-specific differences in decay rates.


