
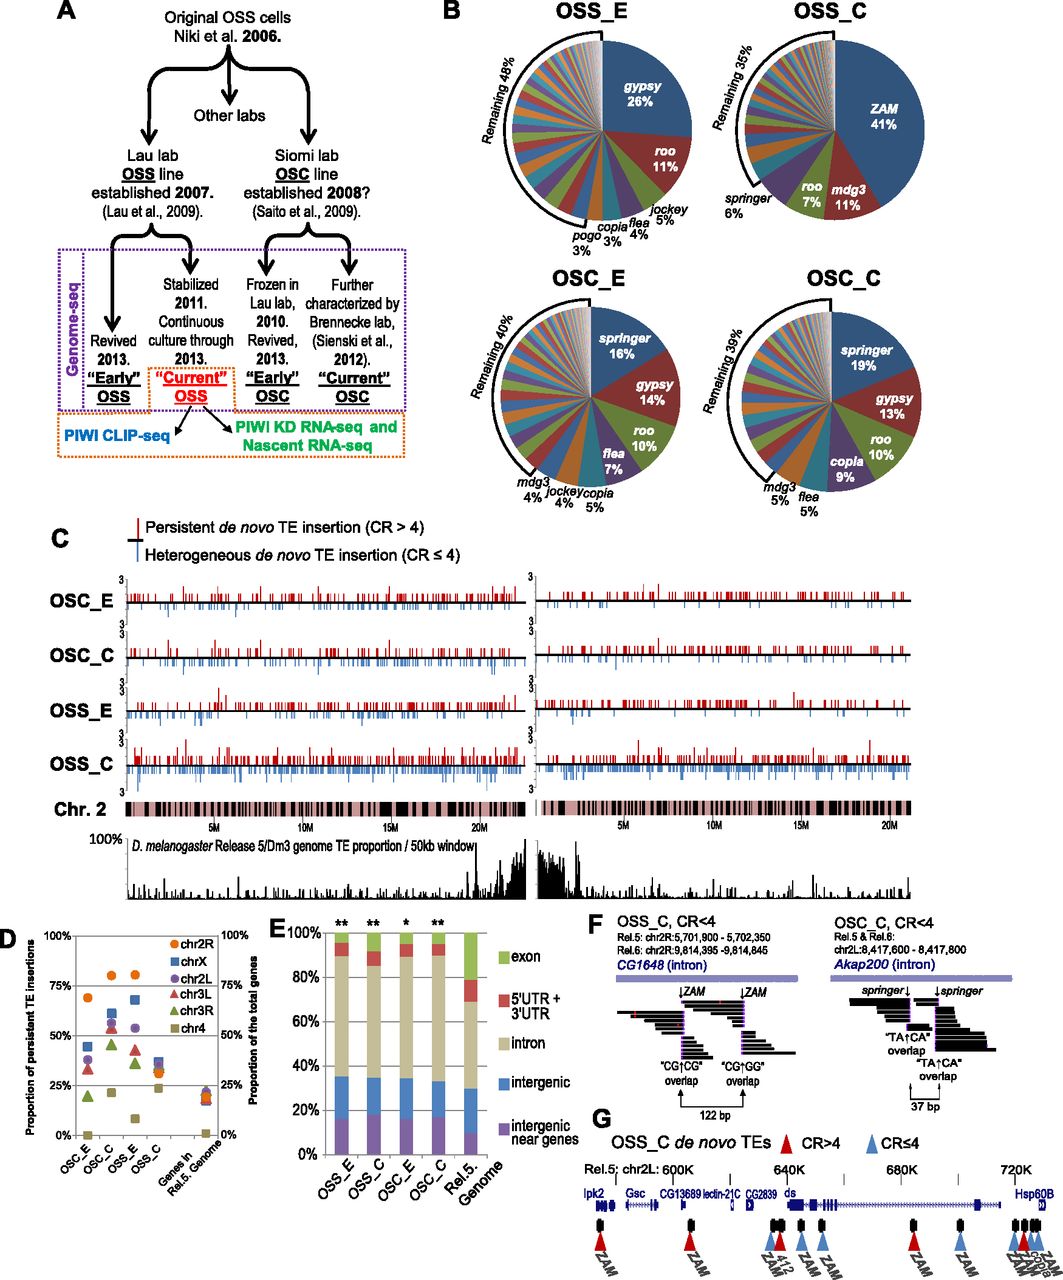
Genome sequencing of follicle cell lines reveals de novo TE landscape diversity. (A) Diagram of the history of the OSS and OSC cell lines used in this study and which genomics approaches were applied to specific cell lines. (B) Proportions of the classes of TEs comprising all de novo TE insertions. (C) Distribution of persistent and heterogeneous TE insertions on the Drosophila chromosome 2, overlaid on the D. melanogaster Release 5/dm3 genome proportions of TEs comprising the left and right arms. Complete genome-TE landscape maps are in Supplemental Figure S6. (D) Dot graph of the ratios of persistent TE insertions among the different chromosomes in the four cell lines. Whereas all chromosomes in OSS_C cells have a similar lower ratio of persistent TE insertions, chromosome 2R has a notably higher proportion of persistent TE insertions in OSC cells and OSS_E cells. (E) The frequencies of TE insertions in different genome functional regions are significantly distinct from the expected proportions of functional regions in the Release 5/dm3 reference genome. (**) P-value < 0.001, (*) P-value < 0.05; Fisher’s exact test. (F) Examples of tandem de novo TE insertions in OSS_C and OSC_C cells. (G) An emerging “hot spot” for multiple ZAM insertions in the OSS_C genomes.


