
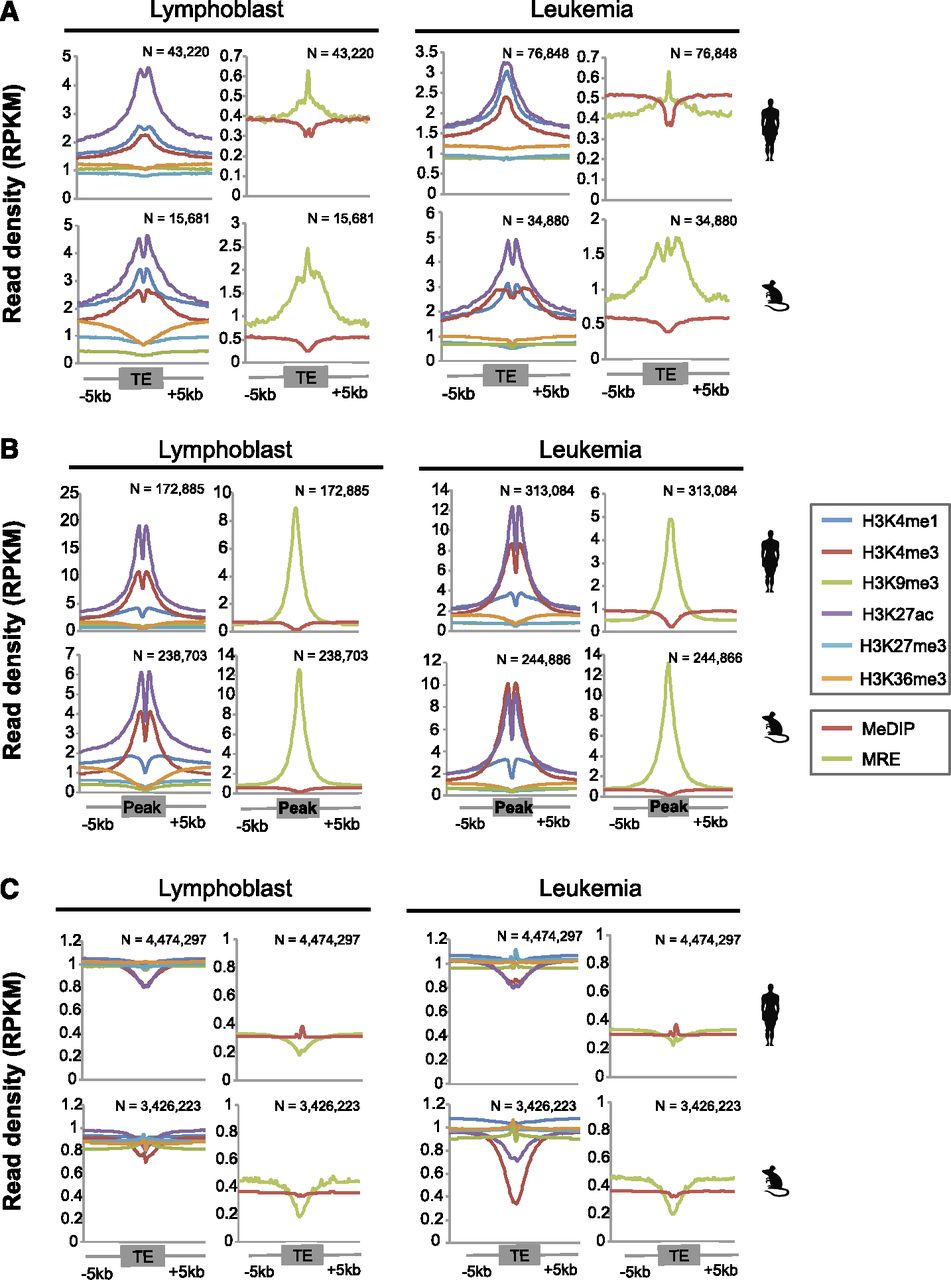
Epigenetic profile of TE-derived TF binding peaks in lymphoblast and leukemia cell lines in human and mouse. All figures represent the average signal density at 50-bp resolution over a 10-kb window centered on the genomic regions of interest (i.e., TEs or peaks). Left panels display profiles of histone modification marks, and the right panels display DNA methylation data. (A) Epigenetic profile of TE-derived TF binding peaks, which represents TEs that contained binding peaks for any one TF in human (upper panels) and mouse (lower panels). (B) Epigenetic profile of TF binding peaks that do not overlap any TE. (C) Epigenetic profile of TEs that do not overlap any TF binding peak.


