
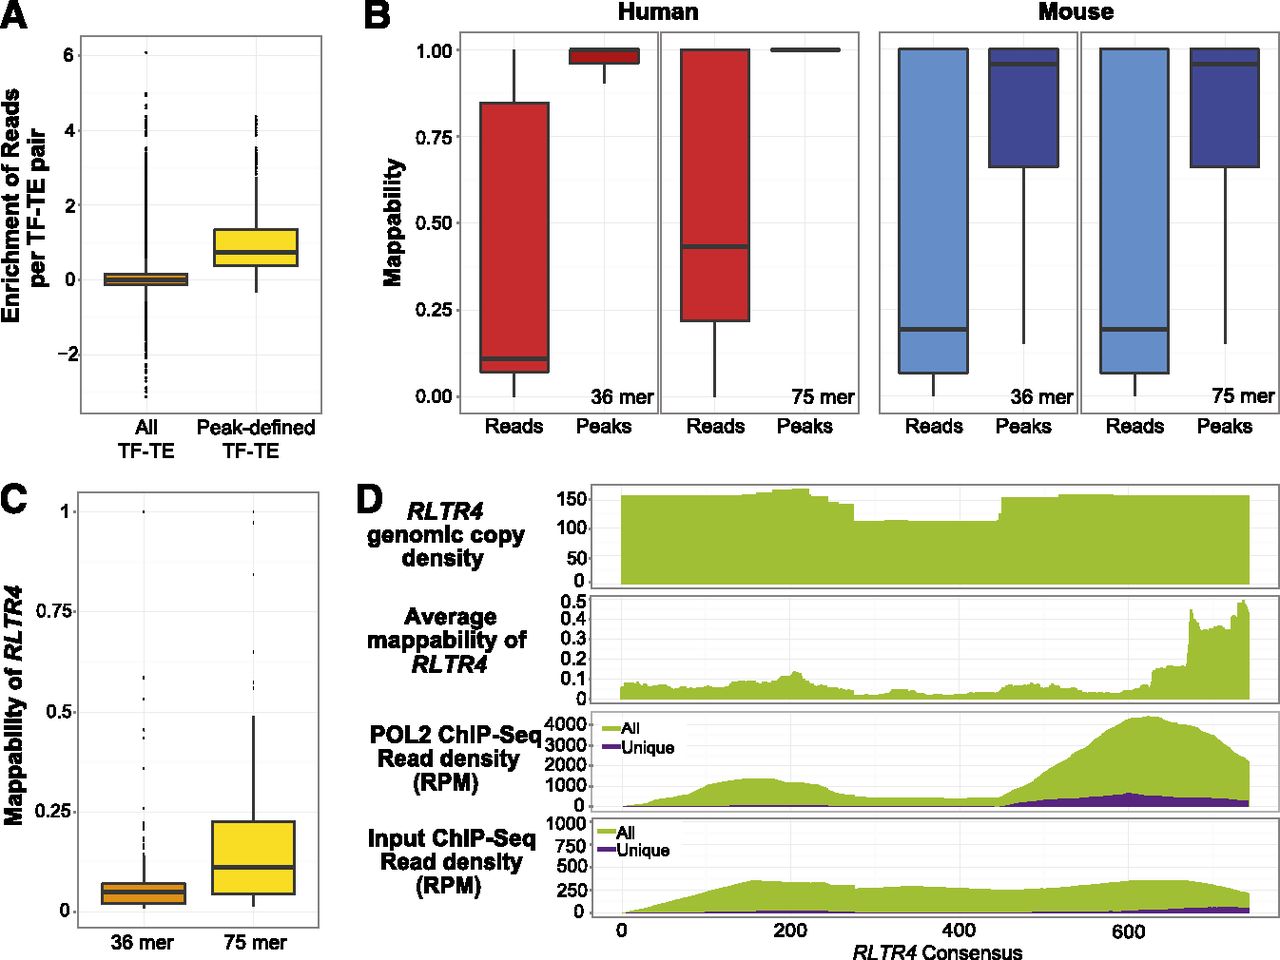
Including nonuniquely mapped reads (multireads) captured additional binding events on TEs. (A) Comparison between the enrichment of reads (see Methods) for all TF–TE pairs and TF–TE pairs that were enriched for interactions defined by peaks (see Methods). (B) Distribution of mappability scores (for 36-mer and 75-mer, respectively) of TE subfamilies. (Peaks) TE subfamilies enriched for TF binding peaks; (reads) TE subfamilies enriched for ChIP-seq reads (including both unique and nonunique reads). We calculated the mappability score (level of sequence uniqueness) for each genomic copy of a particular TE subfamily using mappability tracks downloaded from the UCSC Genome Browser, where 1.0 = 100% mapped uniquely, and 0 = 0% mapped uniquely. (C) Distribution of the mappability scores for the genomic copies of the RLTR4 subfamily in mouse by using 36-mer and 75-mer sequence reads. (D) Comparison of the ChIP-seq signal using unique and all reads in RLTR4. The first panel shows genomic coverage of RLTR4 copies on the RLTR4 consensus sequence. The second panel shows the average mappability (75-mer) score (mappability file was downloaded from the UCSC Genome Browser). The third panel shows the accumulation of POL2 ChIP-seq reads over RLTR4 consensus, with purple representing unique reads, and green representing both unique and non-unique reads. The fourth panel shows the accumulation of ChIP input reads over the RLTR4 consensus sequence.


