
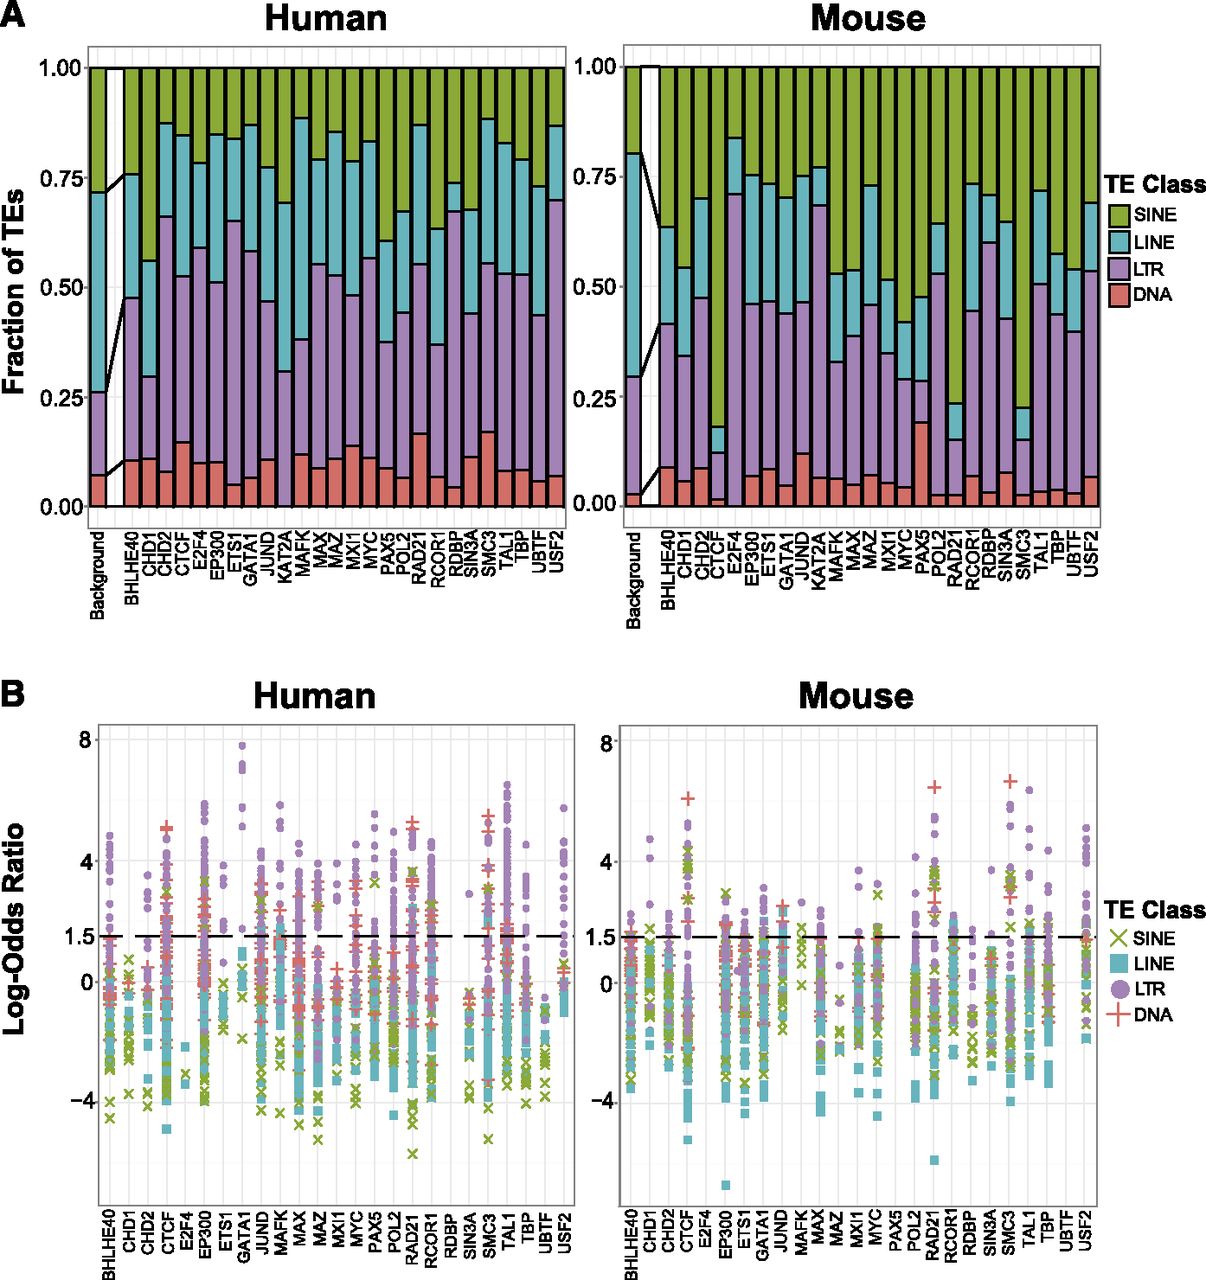
Specific TE classes and subfamilies enriched for TF binding peaks. (A) Proportion of the TF binding peaks that occurred in each TE class in human (left panel) and mouse (right panel). For comparison, “Background” represents the proportion of the genome (in bp) that each TE class constitutes. (B) Enrichment of TF binding peaks in TE subfamilies. We used a log-odds ratio (see Methods) for the definition of enrichment and estimated this for each TE subfamily in human (left panel), and mouse (right panel). Dots with the same color and shape represent TE subfamilies that belong to the same TE class. Several TFs lack data points, which represents no enrichment of binding peaks in TE subfamilies because they had ≤10 binding peaks occurring within the subfamily (see Methods).


