
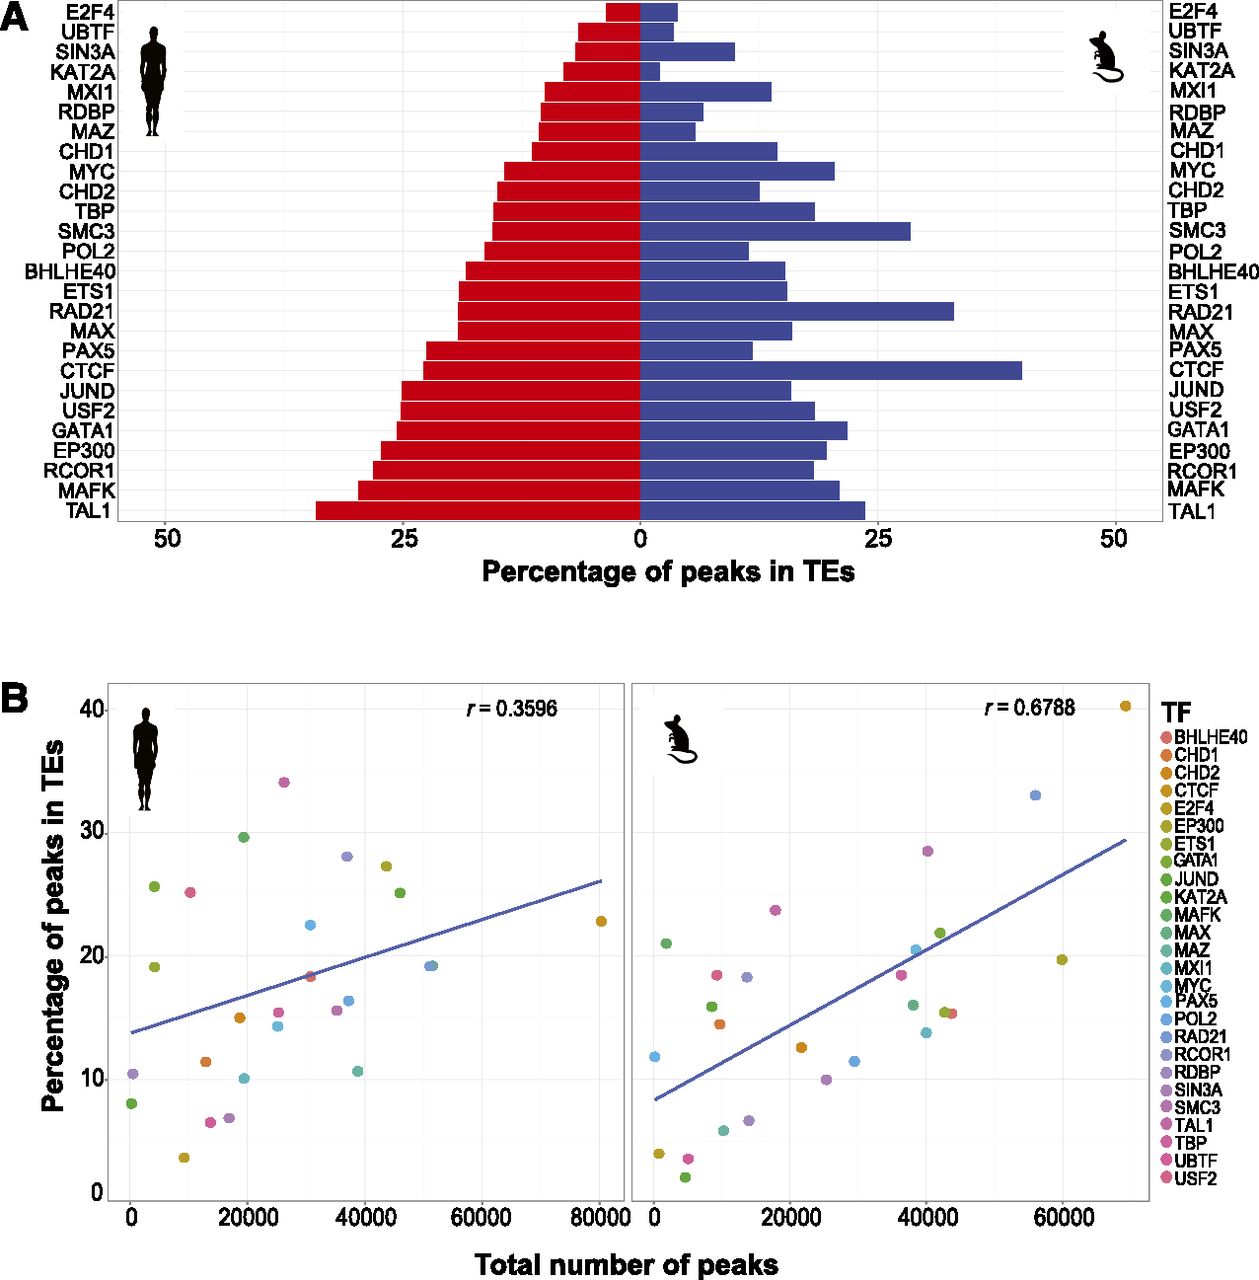
Figure 1.
Different human and mouse TFs had different numbers and fractions of their binding derived from TEs. (A) Percentage of TF binding peaks that occurred in TEs, in human (left panel, red) and mouse (right panel, blue). (B) Correlation between the number of TF binding peaks in the genome and the percentage of the TF binding peaks in TEs in human (left panel) and mouse (right panel). Correlation between these two variables was measured with Pearson’s correlation coefficient (r).


