
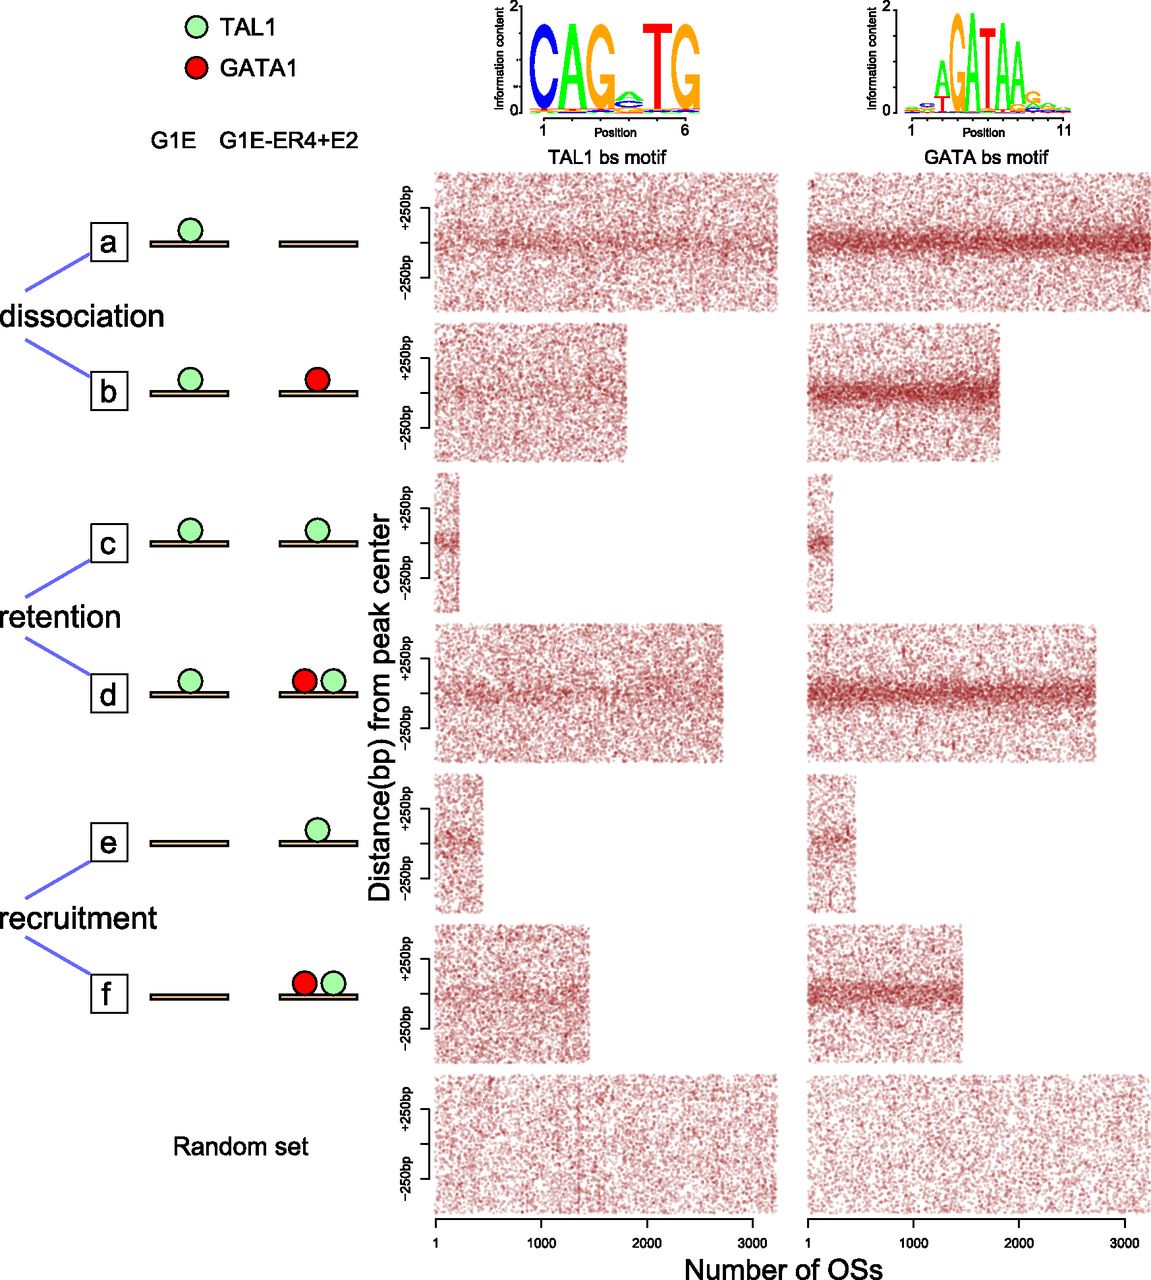
Figure 7.
Distribution of GATA and TAL1 binding site motif instances in different categories of TAL1OSs. The location of DNA sequences matching the binding site motif for GATA factors or TAL1 within 500 bp from the center of each OS is indicated by a red dot. TAL1 OSs were separated into six categories based on the cell types in which they are bound and their co-occupancy by GATA1, shown by diagrams on the left, with green and red disks representing TAL1 and GATA1 occupancy, respectively. In each panel, the OSs were sorted from left to right by increasing occupancy level of TAL1 in the corresponding cell line.


