
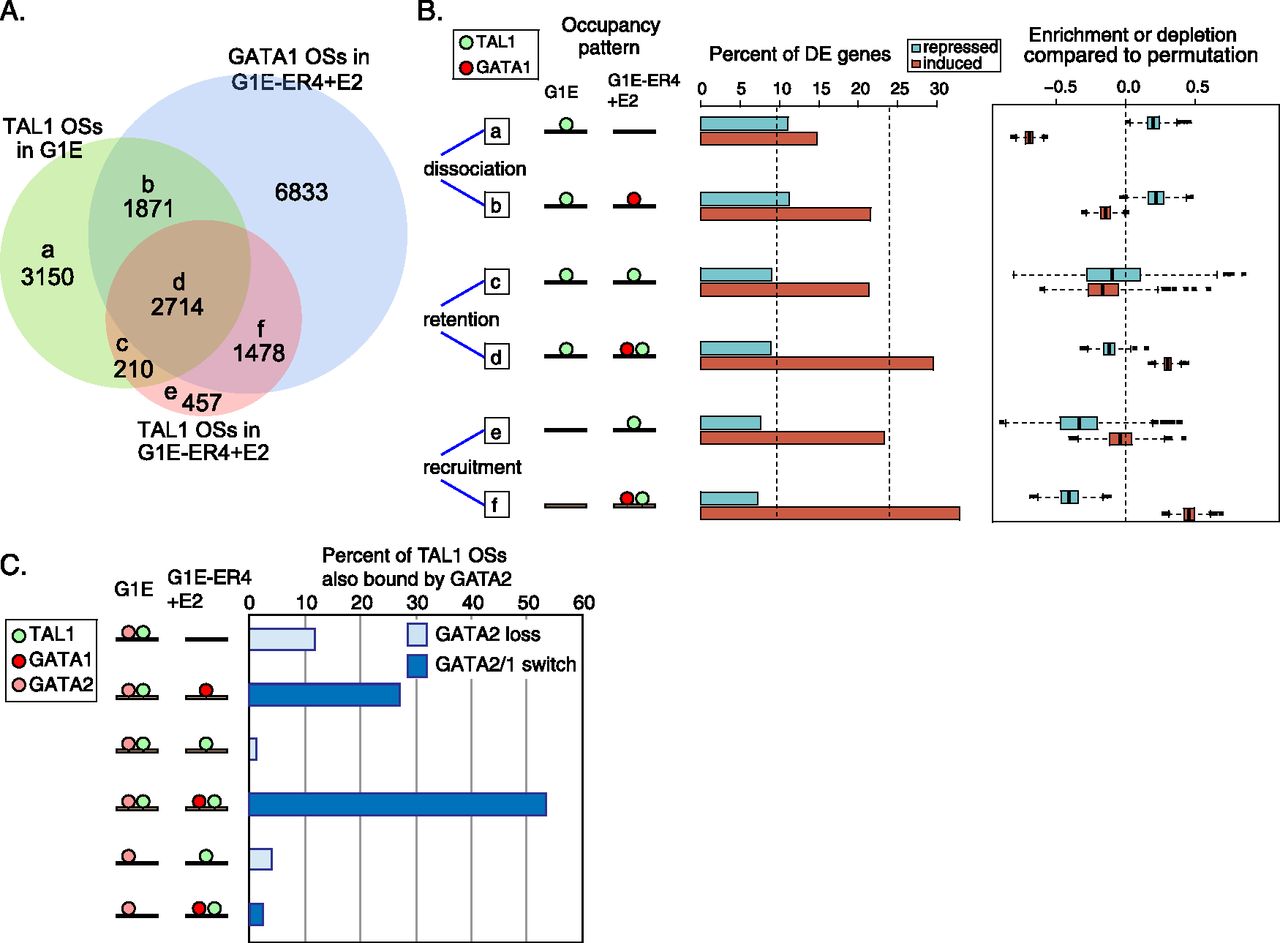
Changes of TAL1 occupancy in GATA1-induced erythroid differentiation. (A) Venn diagram showing TF-occupied DNA segments partitioned by occupancy by TAL1 in G1E and ER4 cells and by GATA1 in ER4 cells. (B) Expression response of presumptive target genes. Genes were associated with TAL1 OSs based on their colocalization in EPUs. For each of the six TAL1 occupancy patterns, the percentages of the differentially expressed (DE) presumptive targets that are induced or repressed are shown as bar plots. The average percentages obtained after 1000 shufflings of the TAL1 OS category (groups a–f) within the matrix are shown by the dotted lines in the bar plot (left for repressed, right for induced). For each of the 1000 permutations, the true percentage of DE genes was divided by the percentage from the shuffled data set. The distributions of the log2 (true percentage/shuffled percentage), shown as box plots, give an estimate of the relative enrichment or depletion for induction or repression of the presumptive gene targets in each TAL1 OS category. (C) Role of GATA2 in TAL1 occupancy. For the subset of TAL1 OSs that is also bound by GATA2 in G1E cells, the percentages that fall into each of the TAL1 OS partitions defined in panel A are plotted. The DNA segments bound by both TAL1 and GATA2 in groups a, c, and e in panel A are GATA2 loss sites, whereas those in groups b, d, and f are GATA switch sites.


