
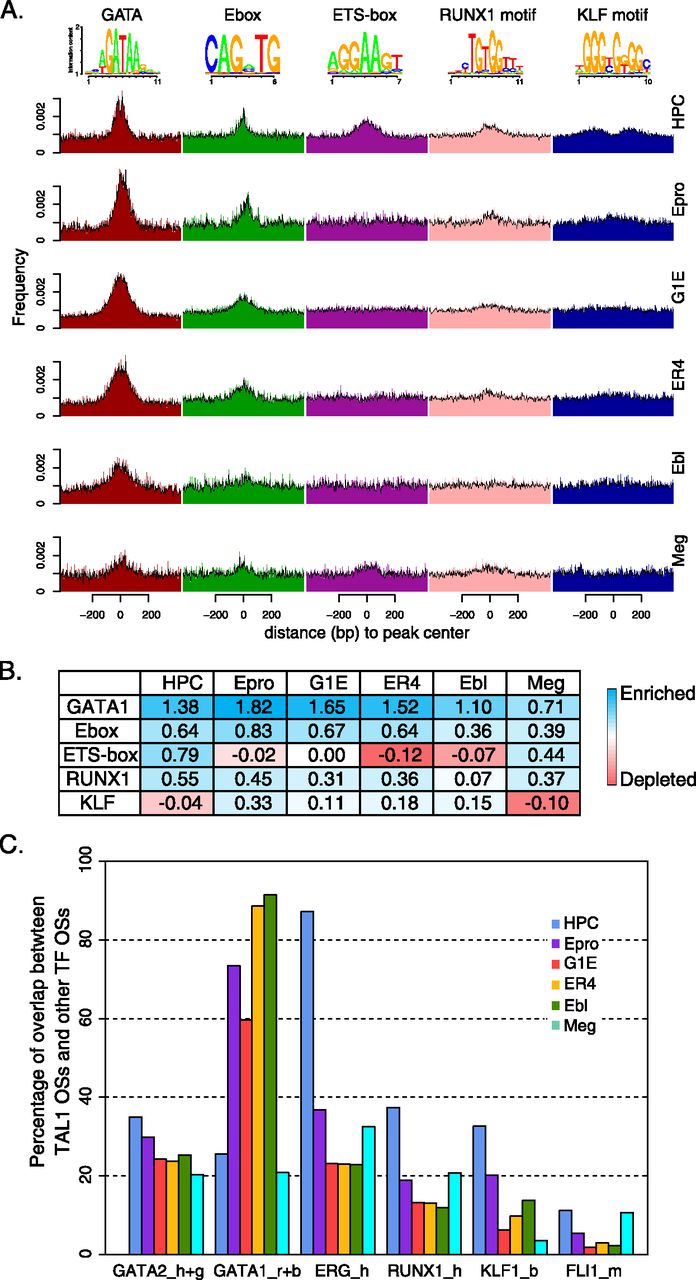
Comparison of enrichment of transcription factor binding site motifs and co-occupancy on TAL1 OSs in six hematopoietic cell types. (A) The locations of five motifs (logos at the top of the panel) on 1-kb intervals (only 800 bp is displayed here) centered on TAL1 OS peak centers were found by FIMO in each of the six cell types. The distribution of the locations is plotted by both histograms (colored bars) and density plots (black curves on top of histograms). (B) Enrichment or depletion of each motif in the TAL1 OSs for each cell type. (C) Fraction of TAL1 OSs (cell types indicated by color key) bound by the transcription factor indicated on the x-axis. Cell types for the transcription factor binding are abbreviated: h, HPC-7; g, G1E; r, G1E-ER4 + E2; b, erythroblast; m, megakaryocytes.


