
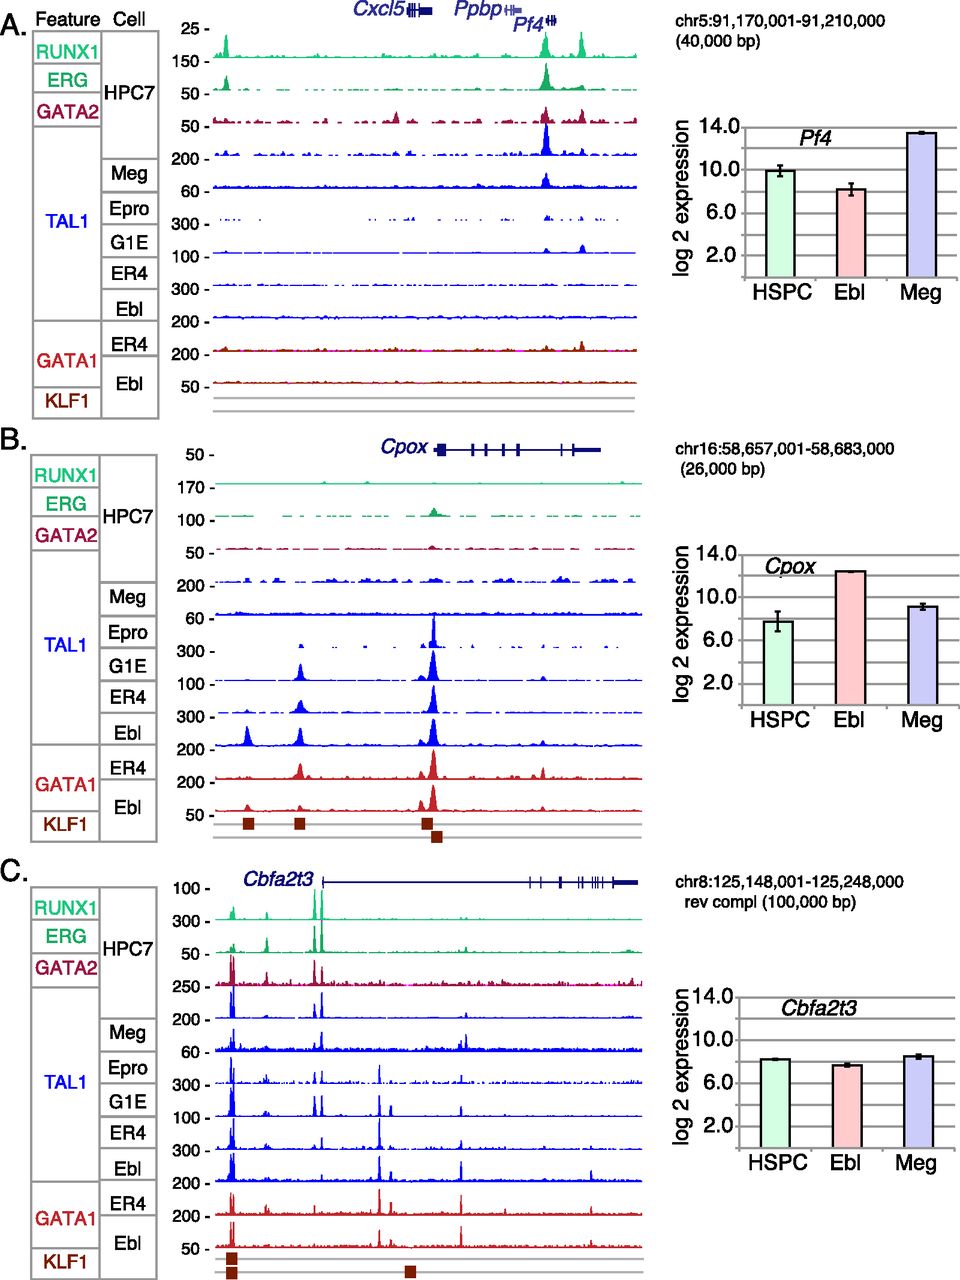
Loci illustrating shifts in patterns of TAL1 occupancy and co-occupancy by other transcription factors among the six differentiation stages. Each panel shows on the left the signal track for each indicated transcription factor binding in the designated cell type. Signal for TAL1 binding is blue; for GATA factors, red; and those for other factors, green. Peak calls for KLF1 in erythroblasts are shown from two different sources; the upper boxes are from Tallack et al. (2010), and the lower boxes are from Pilon et al. (2011). Direction of transcription for each gene is left to right. The graphs on the right show levels of expression in hematopoietic stem progenitor cells (HSPCs), which are a proxy for expression in HPC-7 cells, erythroblasts, and megakaryocytes (Pimkin et al. 2014). (A) The Pf4 gene (encoding platelet factor 4) illustrates TAL1 binding in megakaryocytes and in HPC-7, not in erythroid cells. (B) The Cpox gene (encoding coproporphyrinogen oxidase) is bound almost exclusively in erythroid cells. (C) The Cbfa2t3 gene is bound at multiple locations, which show a diversity of patterns across differentiation.


