
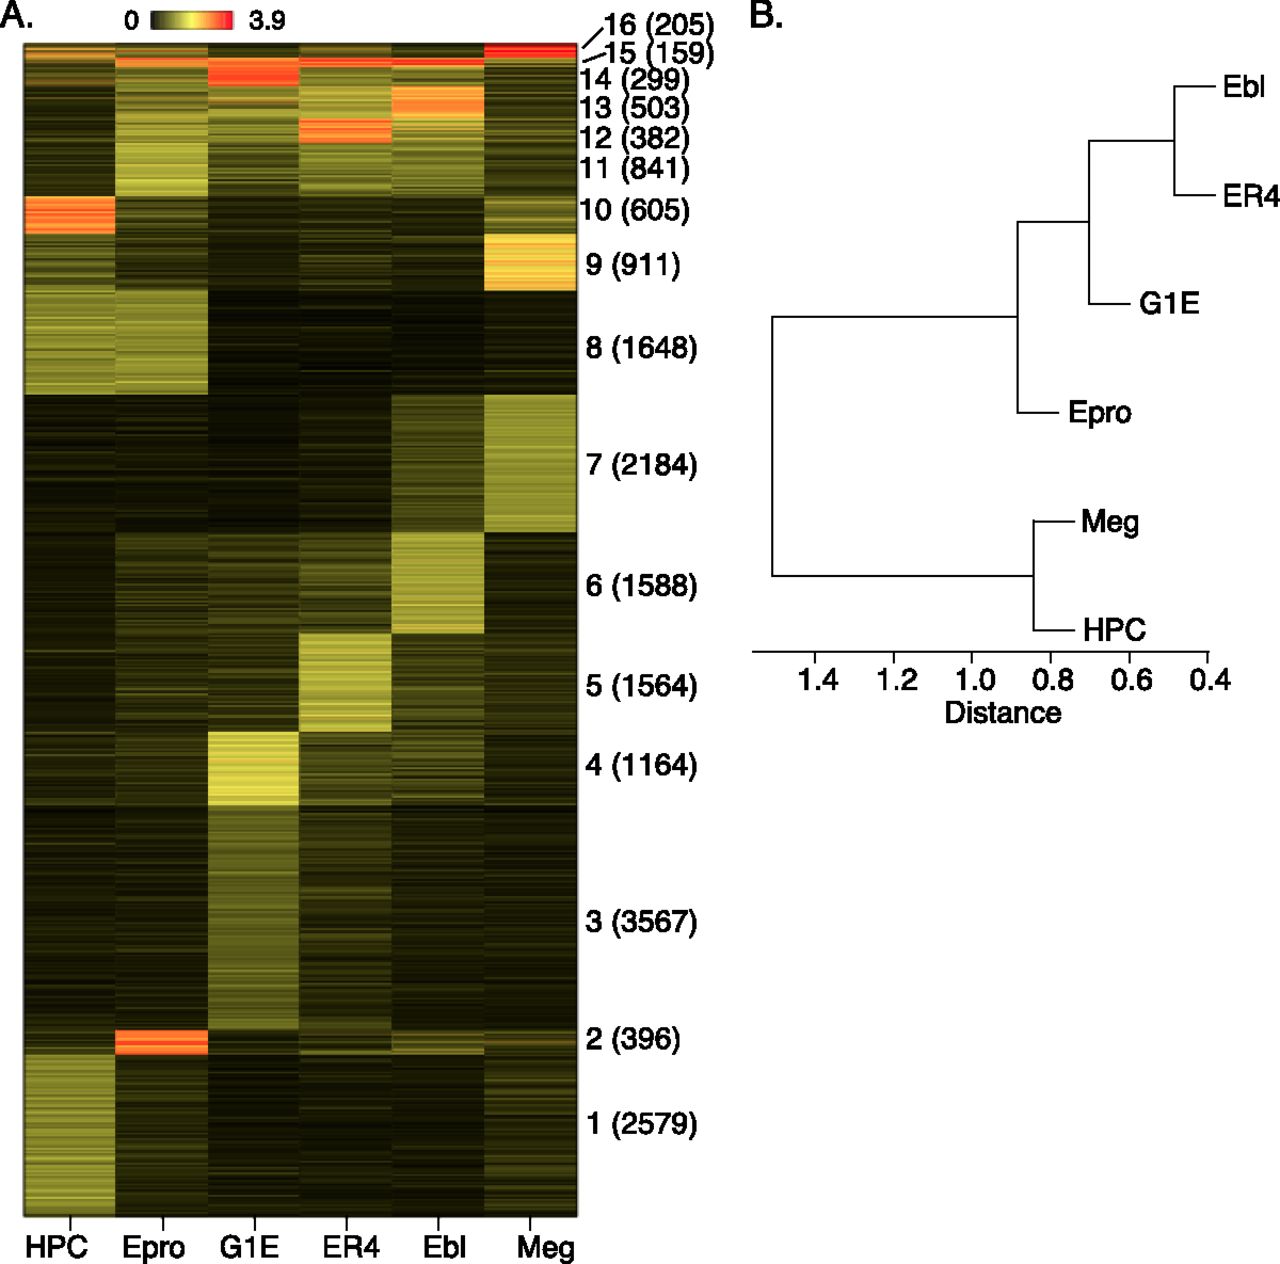
Comparison of TAL1 OSs among multiple cell types. TAL1 peaks were called individually from ChIP-seq reads in each cell type and then concatenated and merged into a union set. (A) The segments were clustered (k-means) based on the TAL1 occupancy signals in the six cell types. The clusters are dominated by binding in the following cell types: 1, HPC-7; 2, Epro (Ter119− erythroid progenitors); 3 and 4, G1E; 5, ER4; 6, Ebl (Ter119+ erythroblasts); 7, Meg (megakaryocytes); 8, HPC-7 + Epro; 9 and 10, HPC-7 + Meg; 11, Epro + ER4 + Ebl; 12–14, all erythroid cells, Epro + G1E + ER4 + Ebl; 15, all six cell types; 16, HPC-7 + Epro + ER4 + Meg. The numbers of segments in each cluster are given in parentheses. (B) The correlation coefficients of the TAL1 binding signals between cell types were computed and clustered by hierarchical clustering, shown as a dendrogram.


