
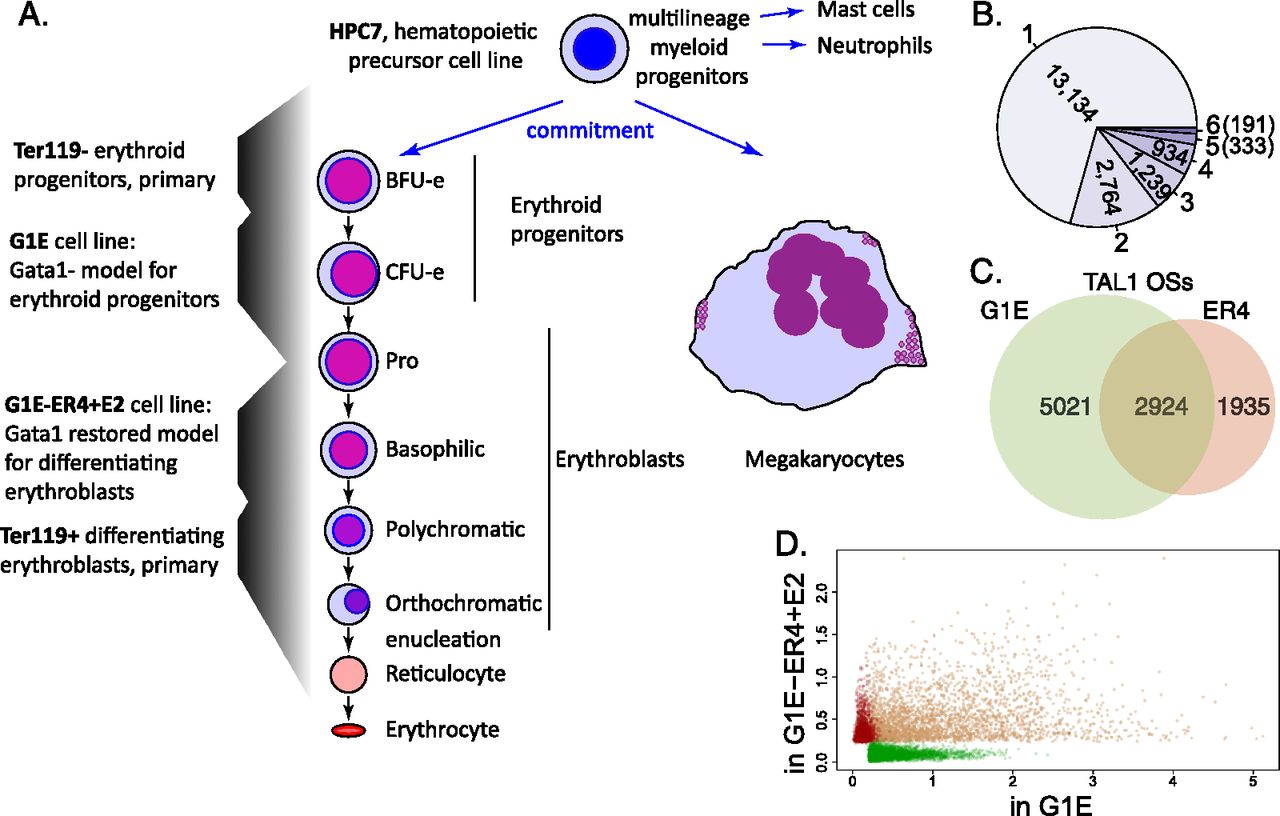
Figure 1.
Erythropoiesis, megakaryopoiesis, and relocation of TAL1 occupancy. (A) The diagram shows differentiation from hematopoietic precursors to erythroblasts and megakaryocytes, including the corresponding cell types or lines used in this study. (B) The numbers of merged TAL1 OSs that are occupied by TAL1 in one to six of the assayed cell types or lines. (C) Venn diagram showing cell type–specific and shared TAL1 OSs in G1E and G1E-ER4 + E2 (ER4) cell lines. (D) Scatter plot showing the normalized ChIP-seq read counts of TAL1 on the TAL1 OSs in G1E versus ER4 cells. The TAL1 OSs identified only in G1E, only in ER4, or both are represented by green, red, or brown dots, respectively.


