
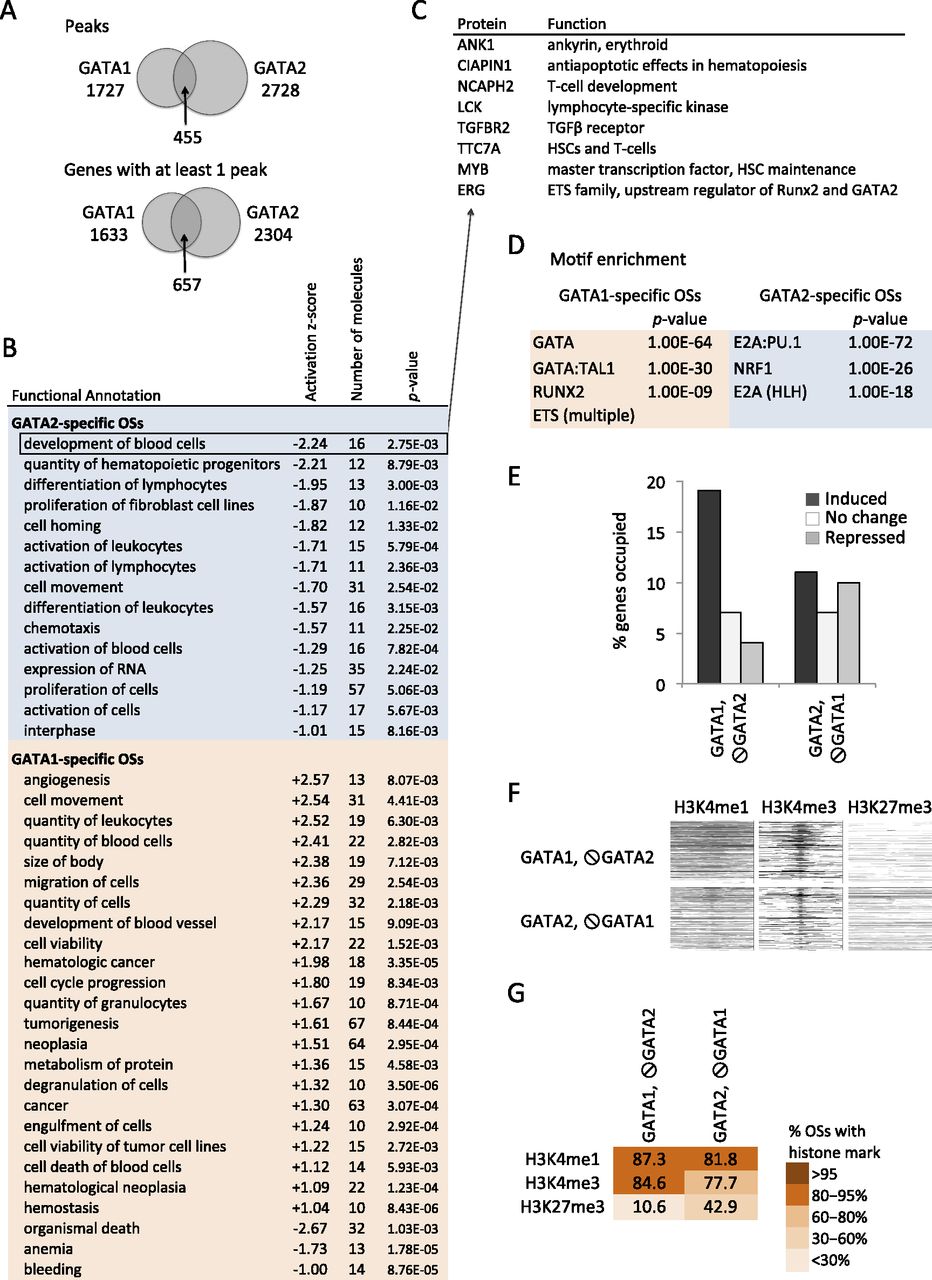
Distinct properties of GATA1 and GATA2 in late megakaryopoiesis. (A) Venn diagram showing the intersection of GATA1 and GATA2 occupancy peaks (Peaks) and bound genes (Genes) in MEG. (B) Ingenuity Pathway Analysis (IPA) showing predicted functions of genes associated with GATA1- or GATA2-specific chromatin OSs. A negative Z-score predicts mean repression of gene expression in the group, whereas a positive score predicts gene induction. Significantly enriched functional categories with ≥10 proteins and absolute Z-scores > 1, are shown. (C) Examples of GATA2-repressed genes in late megakaryopoiesis. (D) Motif enrichment in the 200-bp sequence centered on the transcription factor peaks at the GATA1- and GATA2-specific OSs, with those of the alternate GATA factor used reciprocally as background. (E) Fraction of up-regulated, unchanged, and down-regulated genes containing GATA1-selective and GATA2-selective OSs. (F) Heatmaps of H3K4me3, H3K4me1, and H3K27me3 histone modification marks centered around the transcription factor binding peaks at GATA1- and GATA2- specific OSs ordered from top to bottom by transcription factor peak significance. (G) Color-coded fractions of GATA1- and GATA2-specific transcription factor binding sites associated with H3K4me3, H3K4me1, and H3K27me3 histone methylation patterns in MEG.


