
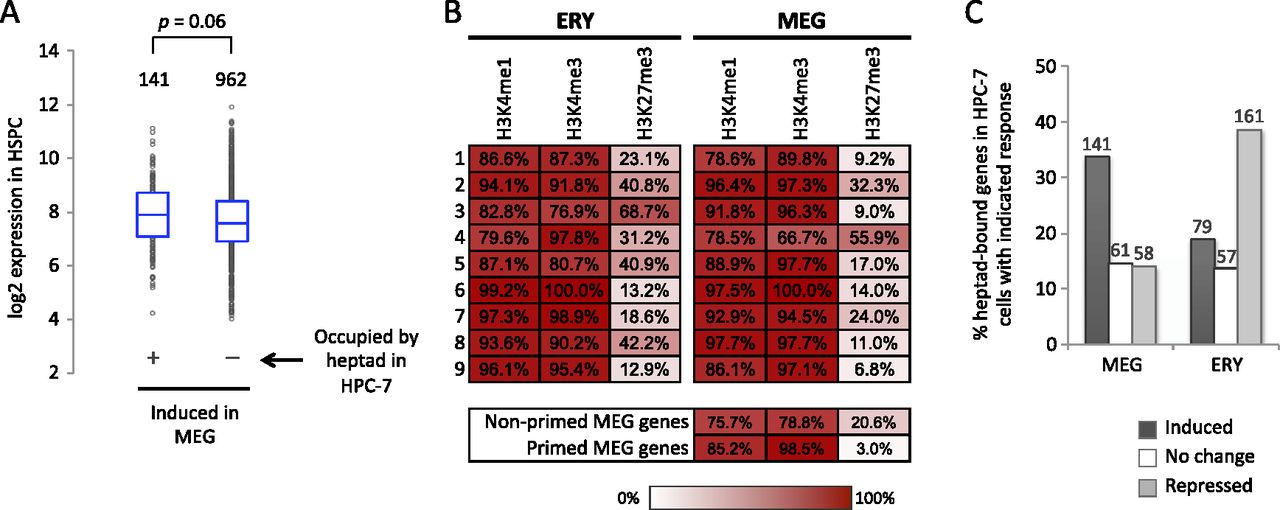
Characteristics of MEG lineage-primed genes. (A) Box-and-whisker plots of baseline expression levels in HSPCs of MEG-induced genes that are bound by the GATA2/LYL1/TAL1/FLI1/ERG/RUNX1/LMO2 transcription factor heptad in HPC-7 cells (Wilson et al. 2010) versus MEG-induced genes with no heptad occupancy in HPC-7 cells. (B) Color-coded distribution of histone methylation marks in the gene clusters defined in Figure 3A. Numbers indicate percentage of genes with H3K4me3, H3K4me1, and H3K27me3 methylation marks within 0.5 kb surrounding the TSS. (C) Fractions of GATA2/LYL1/TAL1/FLI1/ERG/RUNX1/LMO2 heptad-occupied genes in HPC-7 that are induced, unchanged, or repressed in MEG and ERY development, respectively. The numbers of genes in each group are indicated above the bars.


