
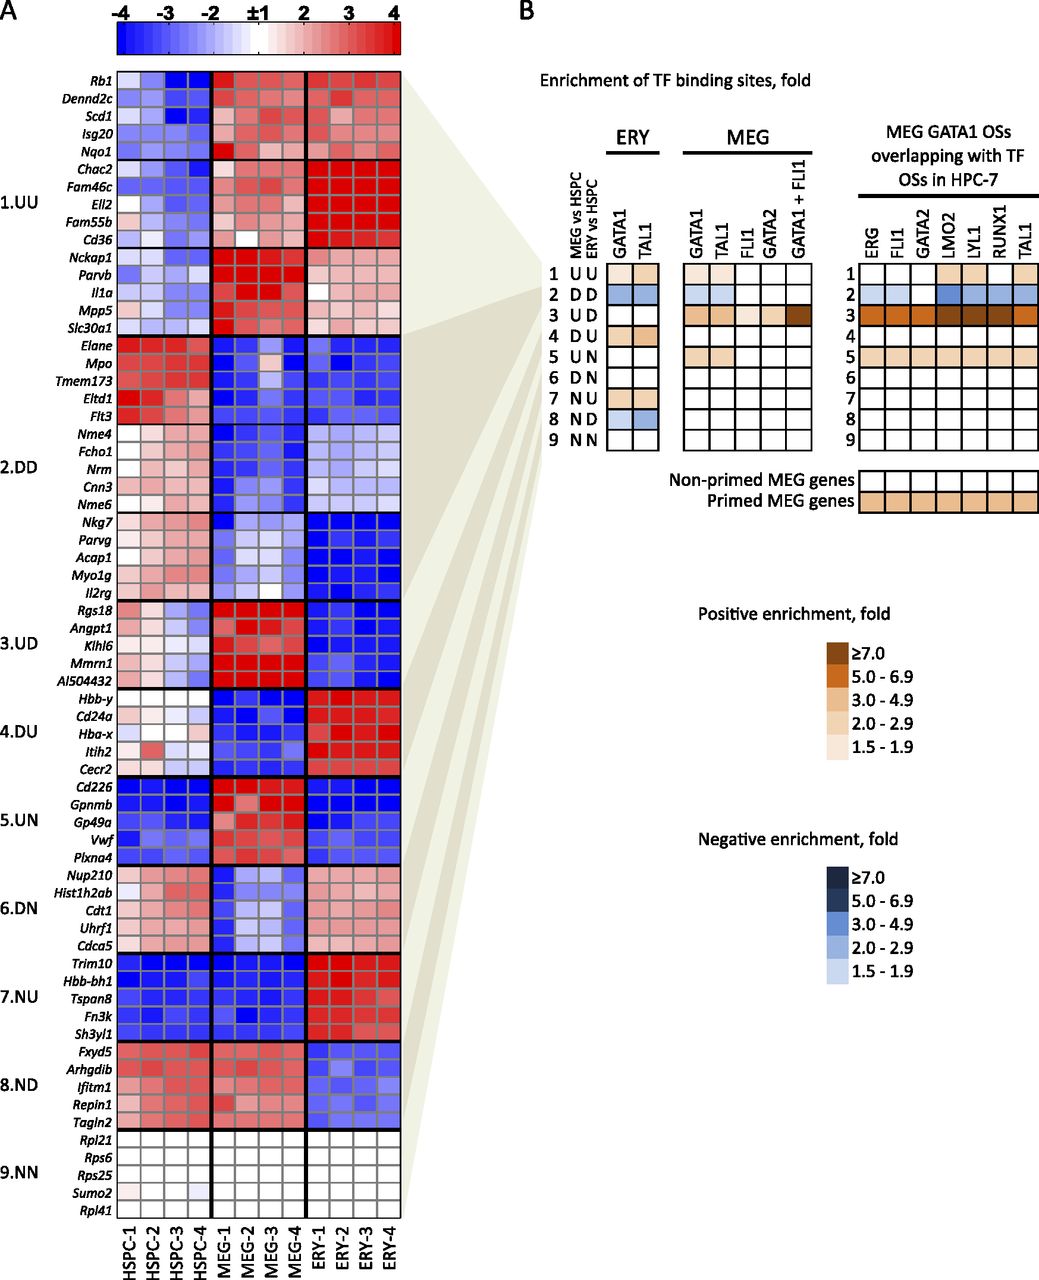
Mechanisms of transcriptional regulation correlate with patterns of erythro-megakaryocytic gene expression. (A) Heatmap of mRNA expression in HSPCs, MEG, and ERY with top changed genes clustered into nine groups according to patterns of expression relative to that of HSPCs. Data from four biological replicates are shown for each lineage. In each cluster, a nonbiased selection of top changed genes is shown: (U) up-regulated; (D) down-regulated; (N) no change. For example, cluster 3, labeled “UD,” represents genes that are up-regulated in MEG and down-regulated in ERY versus HSPCs. Total numbers of genes in each cluster, as well as gene function enrichments, are shown in Supplemental Figure 10A. (B) Over- or underrepresentation of transcription factor occupancy within ERY and MEG genes across the nine expression pattern clusters described in A. The enrichment value is a ratio of the fraction of genes in a given cluster occupied by a given transcription factor versus the fraction of occupied genes in the global expressed gene set of 7513 genes. The color-coding shows positive or negative enrichment of transcription factor binding in each gene cluster relative to the genome-wide average of binding probability (indicated by white color). All enrichments shown have P-values < 0.001 by Fisher’s exact test. The right panel shows enrichments of overlapping of MEG GATA1 OSs with indicated transcription factor OSs in HPC-7 hematopoietic progenitor cells (see Fig. 2; Wilson et al. 2010). The bottom panel shows enrichment of transcription factor binding in primed versus nonprimed MEG genes.


