
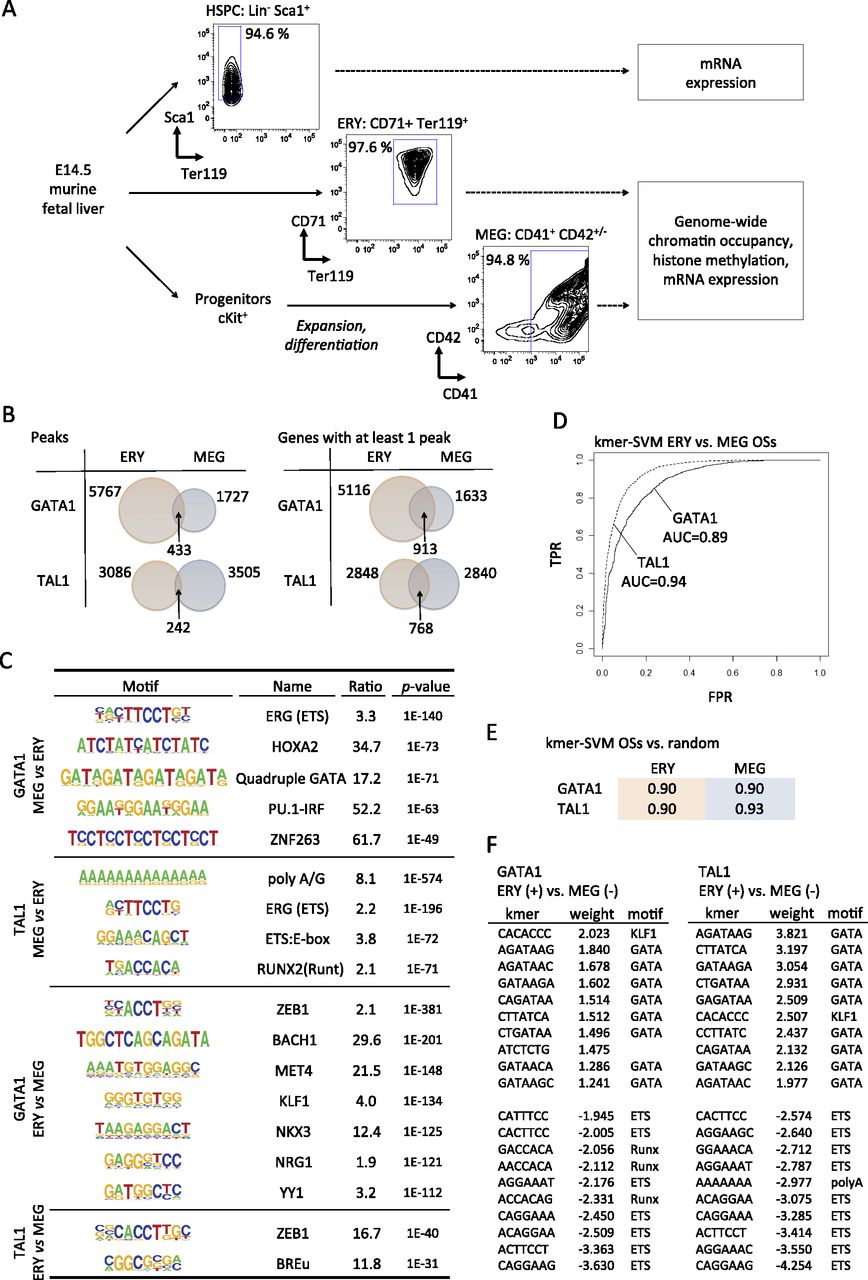
Context-specific functions for GATA1 and TAL1 in erythro-megakaryopoiesis. (A) Experimental scheme for deriving and analyzing hematopoietic stem cell and progenitor cells (HSPCs), erythroblasts (ERY), and megakaryocytes (MEG) from murine fetal liver. (B) Venn diagrams showing the intersection between ERY and MEG of transcription factor occupancy site (OS) peaks (Peaks) and transcription factor-bound genes (Genes). The latter is defined as a gene with at least one OS peak mapping between 10 kb upstream of the TSS and 3 kb downstream from the polyadenylation signal (Cheng et al. 2009; Wu et al. 2011). Genes containing multiple OSs were counted only once. (C) Motifs overrepresented in the 200-bp sequences surrounding the GATA1 peak center in ERY versus MEG, and vice versa. (D) ROC curves for kmer-SVM on GATA1 OSs in ERY versus MEG and TAL1 OSs in ERY versus MEG. (TPR) True positive rate; (FPR) false positive rate. (E) kmer-SVM results (AUC) for GATA1 and TAL1 OSs trained against random sequences. (F) High weight k-mers correspond to known cofactor binding sites. In ERY, KLF1 motifs predict GATA1 binding and GATA motifs predict TAL1 binding. In MEG, ETS and RUNX motifs are positive predictors of GATA1 and/or TAL1 binding.


