
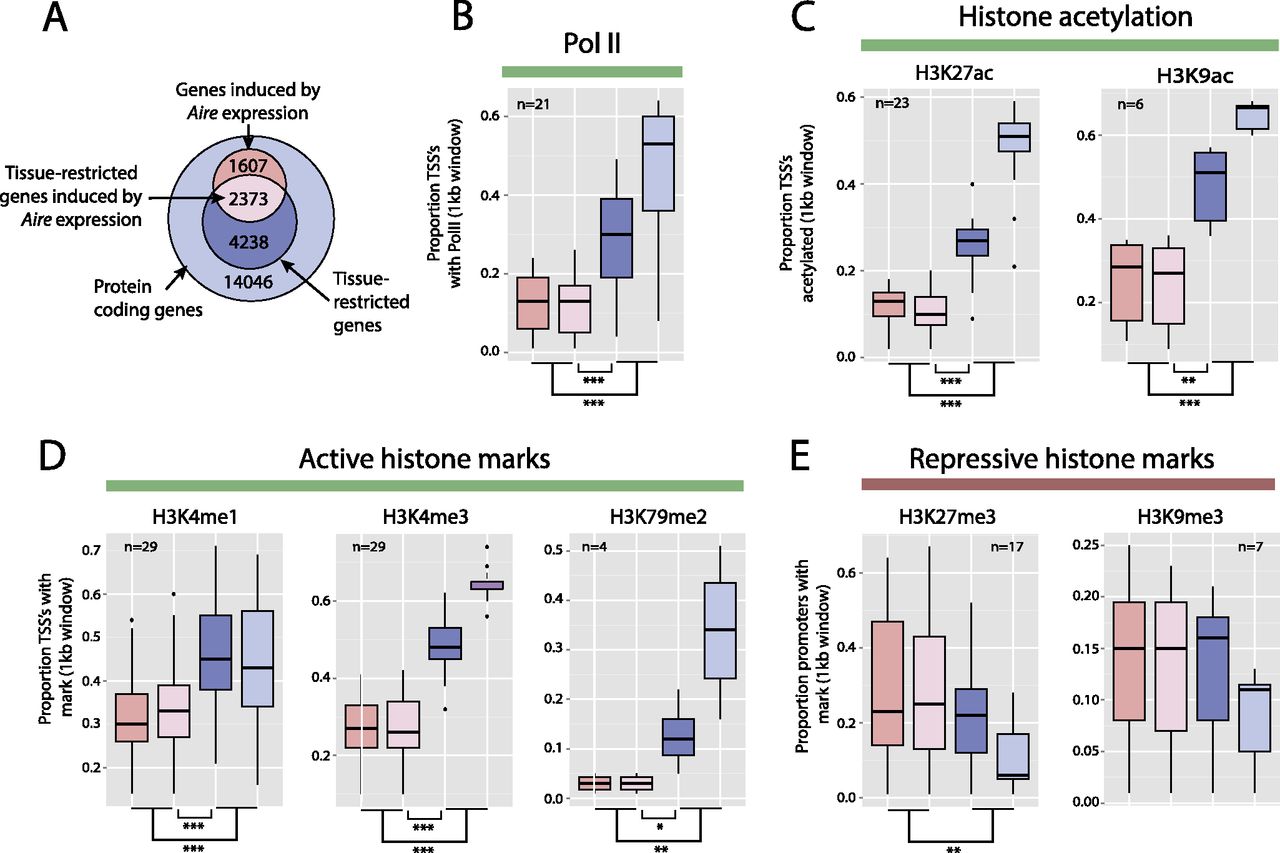
Genes induced by Aire expression are characterized by a repressive chromatin state in somatic tissues. (A) Genes were divided into sets comprising Aire expression-induced (light pink) or Aire expression-independent TRAs (dark blue), other genes induced by Aire expression (dark pink), and all other genes (light blue). The proportion of genes in each of these sets with TSS overlapping Mouse ENCODE ChIP-seq peaks in various tissue and cell types was assessed. (B) Box and whisker plots show the distribution of proportions of the four gene sets (see panel A) overlapping RNA polymerase II (Pol II) ChIP-seq calls from 21 Mouse ENCODE samples. The TSS of tissue-restricted genes induced by Aire expression overlap significantly less frequently with Pol II binding sites than those of other TRAs. A similar pattern was observed for histone acetylation (C) and active histone marks (D). In contrast, the TSS of genes induced by Aire expression show significantly greater overlap with H3K27me3 across 17 Mouse ENCODE samples (E). The n-values represent the number of Mouse ENCODE samples analyzed. (*) P < 0.05, (**) P < 0.01, (***) P < 0.001, using the Mann-Whitney U-test. Colors as in A.


