
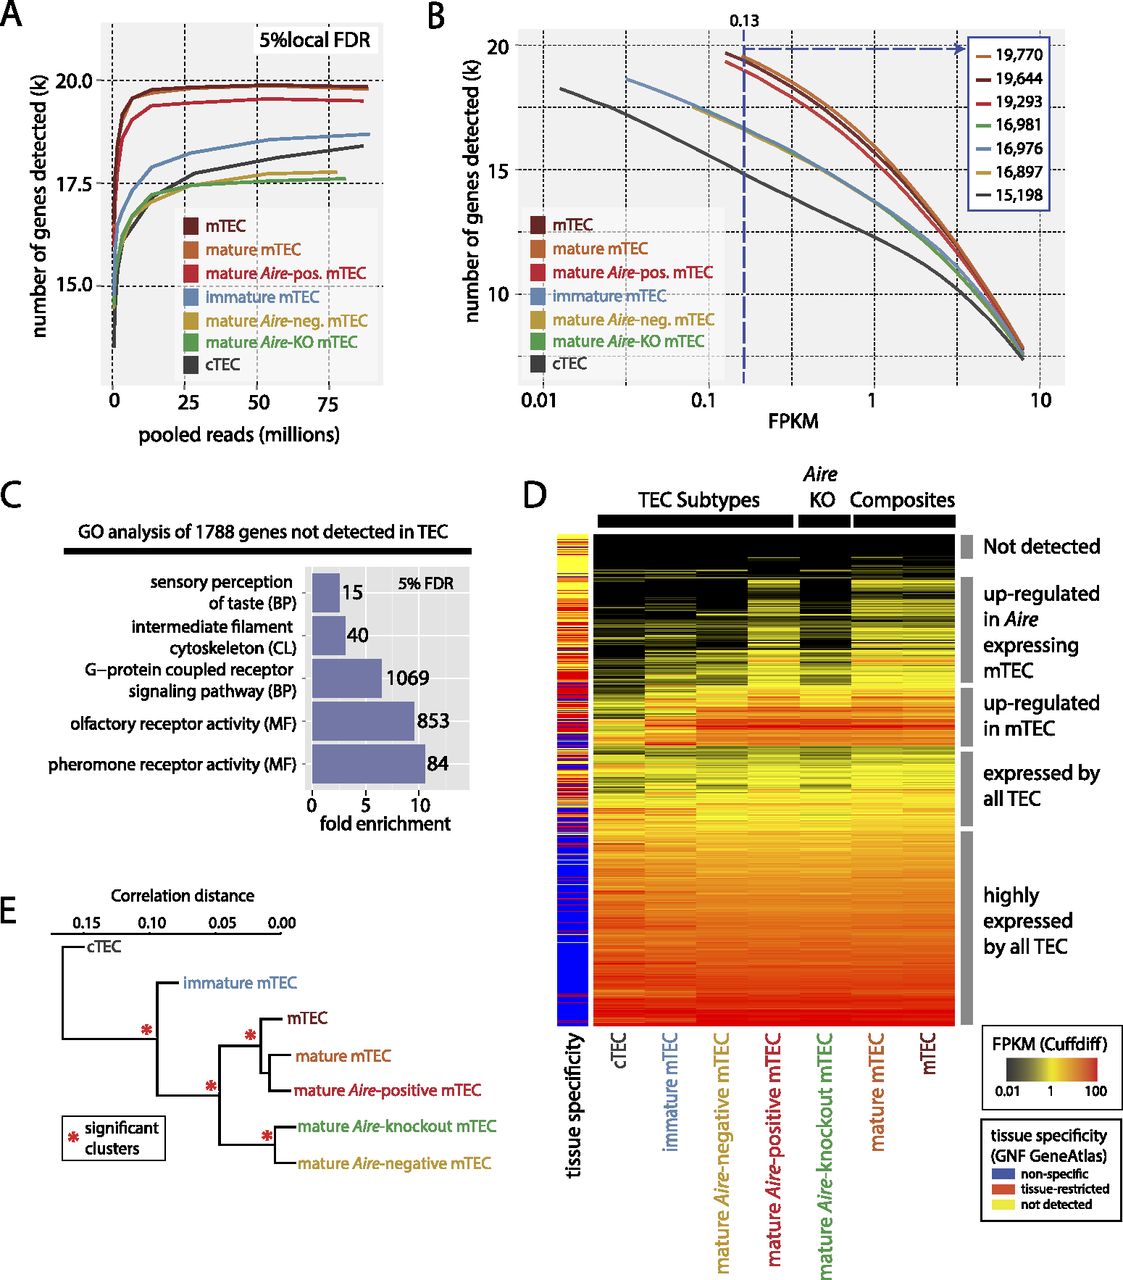
RNA-seq analysis reveals the full extent of PGE in TEC. (A) The number of genes detected in each FACS sorted TEC population at a local FDR of 5% (see Methods; Supplemental Fig. 3; Supplemental Table 2) as a function of read depth (pooled replicates) indicates that read depth was not limiting for most of the TEC populations. (B) The number of genes detected in the TEC populations at different FPKM thresholds. The left-hand start of the solid lines indicates the expression level that corresponds to a local FDR of 5% for a given TEC population (see also Supplemental Fig. 3C). The vertical blue dashed line indicates the FPKM at which genes can be reliably detected in all TEC types (numbers of genes detected at this threshold are shown in inset). (C) Selected GO categories enriched in genes not detected in any TEC population reveal a striking enrichment for odorant receptors (Supplemental Fig. 5). (CL) Cellular location; (BP) biological process; (MF) molecular function. (D) Hierarchical clustering of the expression levels of all protein-coding genes in the TEC populations reveals three distinct strata of PGE. The color key to the left of the heatmap indicates the tissue specificity of genes in the GNF GeneAtlas according to the dynamic step method (Methods; Supplemental Fig. 6). (E) Hierarchical clustering of the TEC populations by gene expression correlation distance reveals four significant clusters (red asterisks, P > 0.95).


