
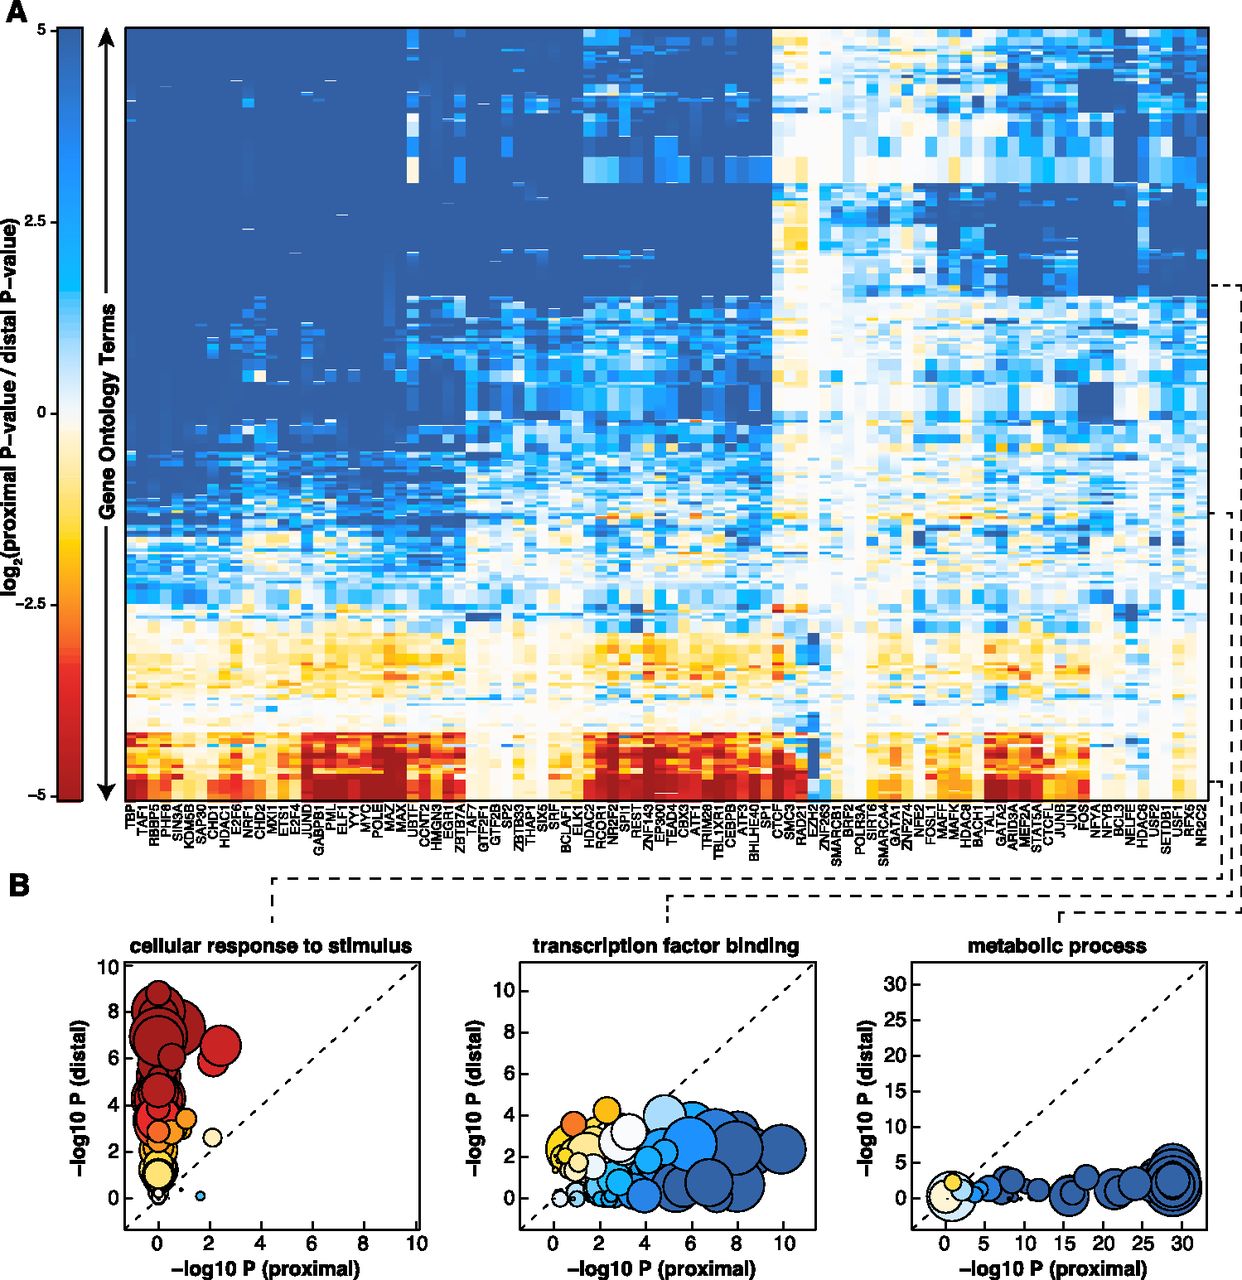
Proximal vs. distal regulation of GO terms. (A) Heatmap comparing enrichment of GO terms in proximal vs. distal targets of each TF. Each row corresponds to a GO term. Each column corresponds to a transcription factor. Red indicates greater enrichment in distal targets. Blue represents greater enrichment in proximal targets. (B) Three plots highlighting examples of GO terms that exhibit different profiles of enrichment. Each circle represents a TF. The size of the circle represents the number of targets in that GO term that the TF factor regulates (both proximally and distally). The color of the circle represents the relative enrichment (proximal vs. distal) using the same scale as shown in A.


