
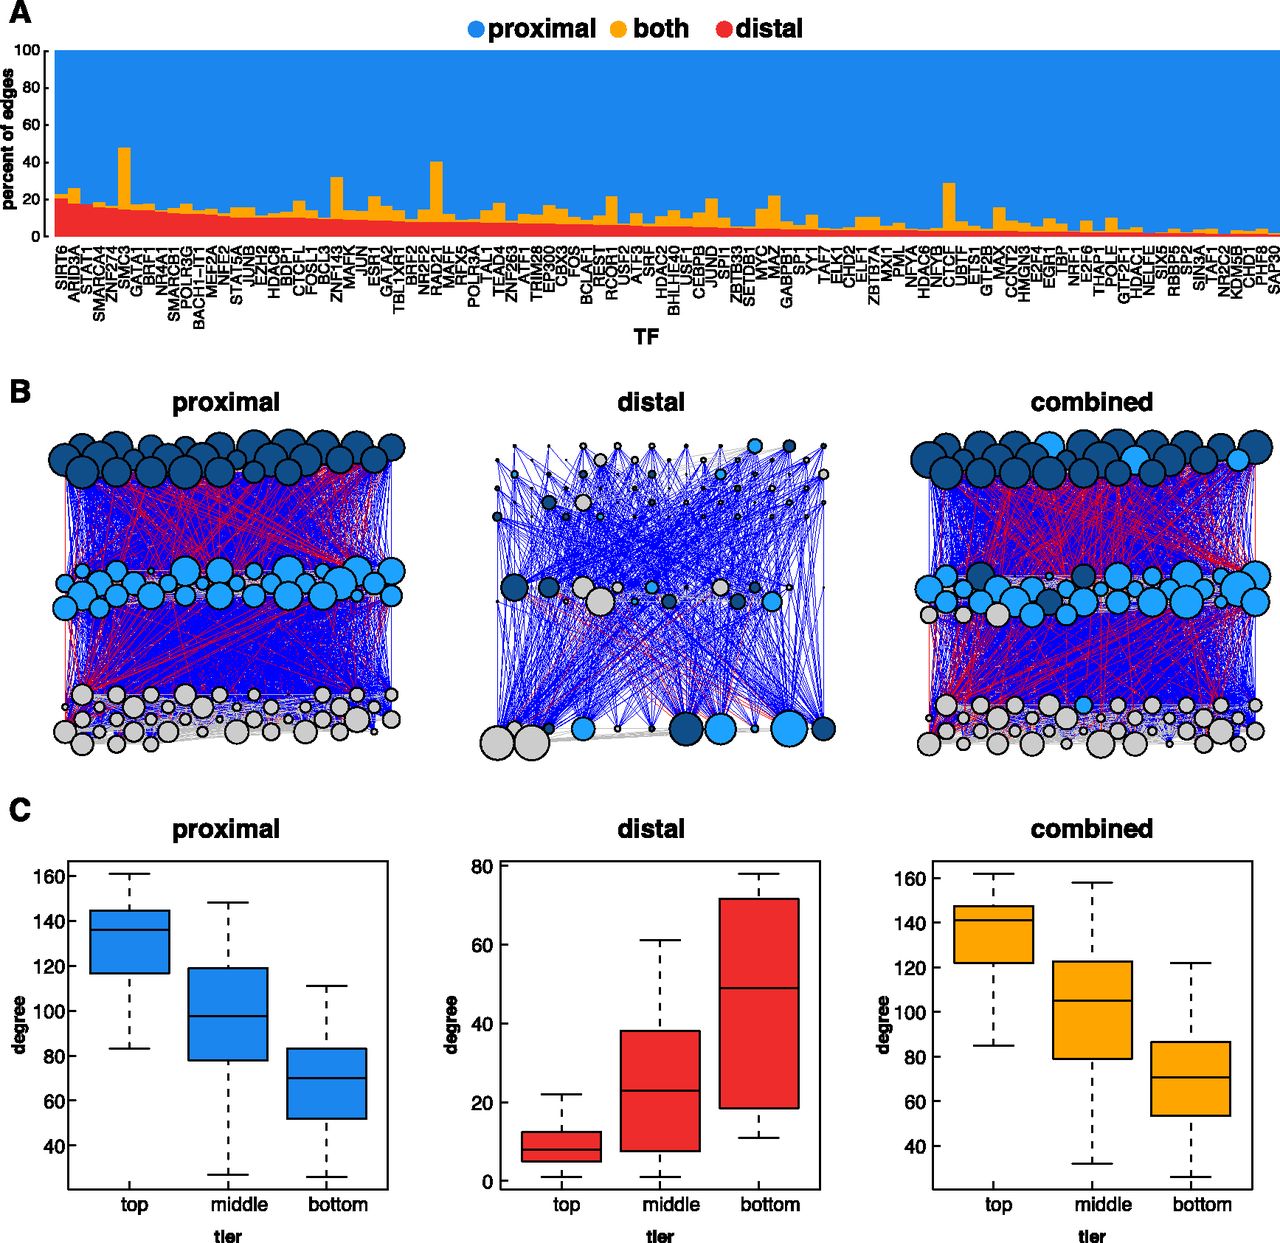
Proximal vs. distal network architecture in K562 cells. (A) For each TF, the percentage of targets found in the distal, proximal, or both networks is depicted. (B) Hierarchical networks built from proximal, distal, and combined TF-only networks. Blue lines represent downward edges, red lines represent upward edges, and gray lines represent lateral edges. The colors of the nodes represent the tier in which the node resides in the proximal network. The size of the node represents the degree (total number of inward and outward edges) for each node in that network. (C) Box and whisker plots depicting the degree (total inward and outward edges) of nodes in each tier of each hierarchical network.


