
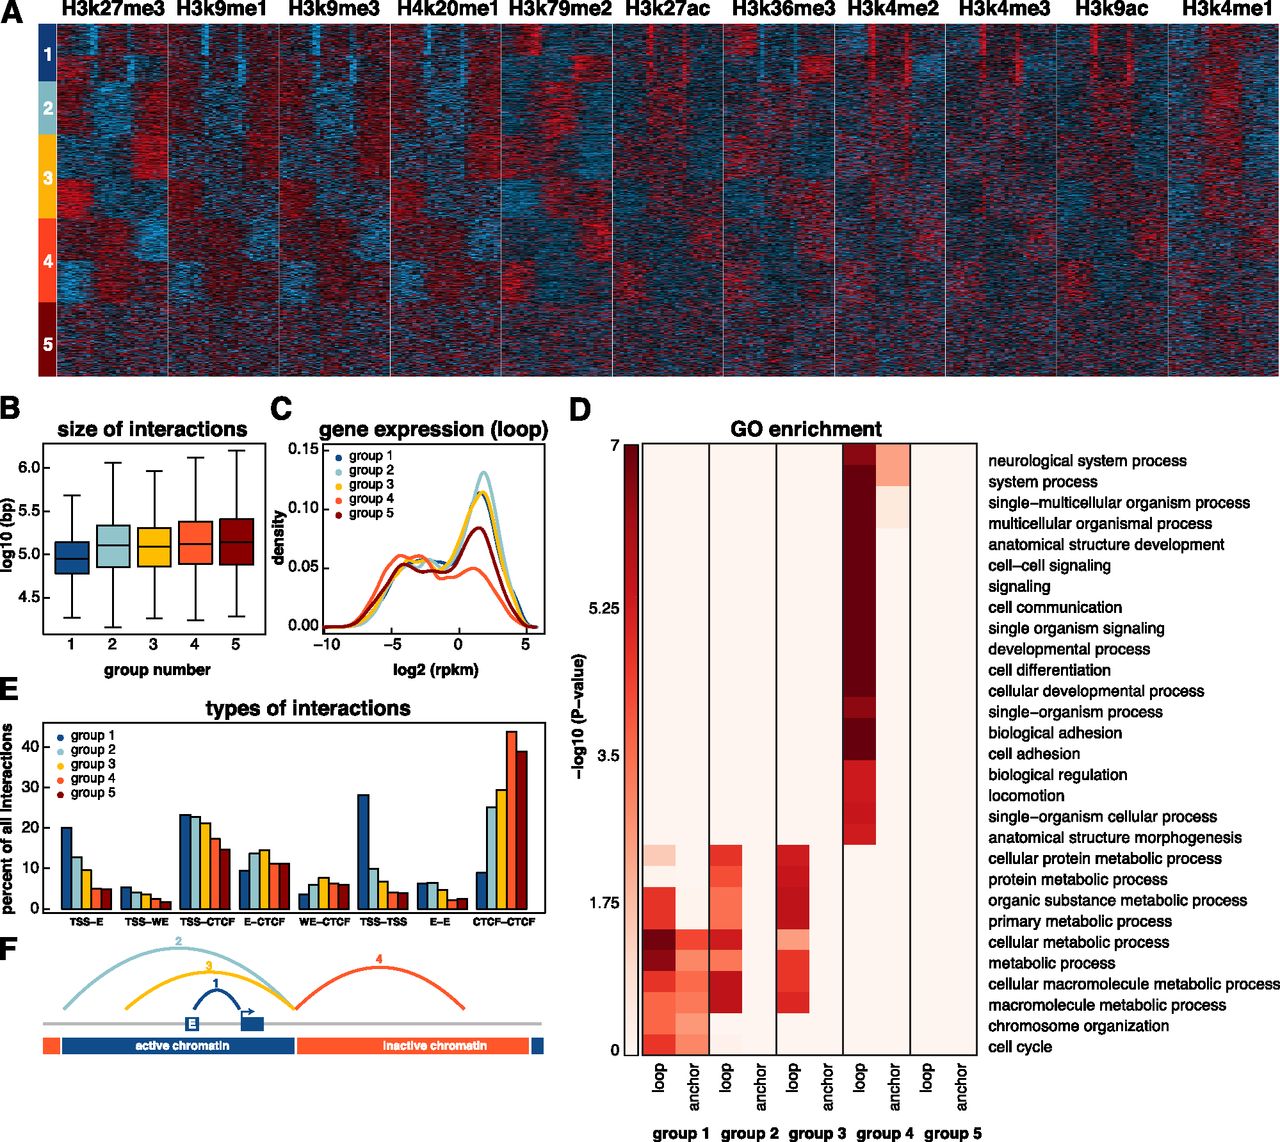
Chromatin domains revealed by clustering interactions. (A) Interactions were clustered into five categories based on the distribution of 11 histone marks. Normalized signals for 11 histone marks were determined in 30 equally sized bins (10 on either side of the interaction and 10 within the loop of the interaction). Interactions were then clustered in eight groups using k-means clustering. Symmetrical groups were grouped to give rise to five final groups. (B) Box and whisker plot depicting the size distribution of interactions in each of the five groups. (C) Density plot showing gene expression values of genes whose promoters reside in the loop regions of each group. (D) GO biological processes enriched in the anchor and loop regions of each of the five groups (P < 10−5, Fisher’s exact test with Benjamini-Hochberg correction). (E) Barplot depicting the percentage of interactions in each of the five groups that links certain types of annotated regulatory elements. (F) Schematic diagram of the loops in each of the first four groups.


