
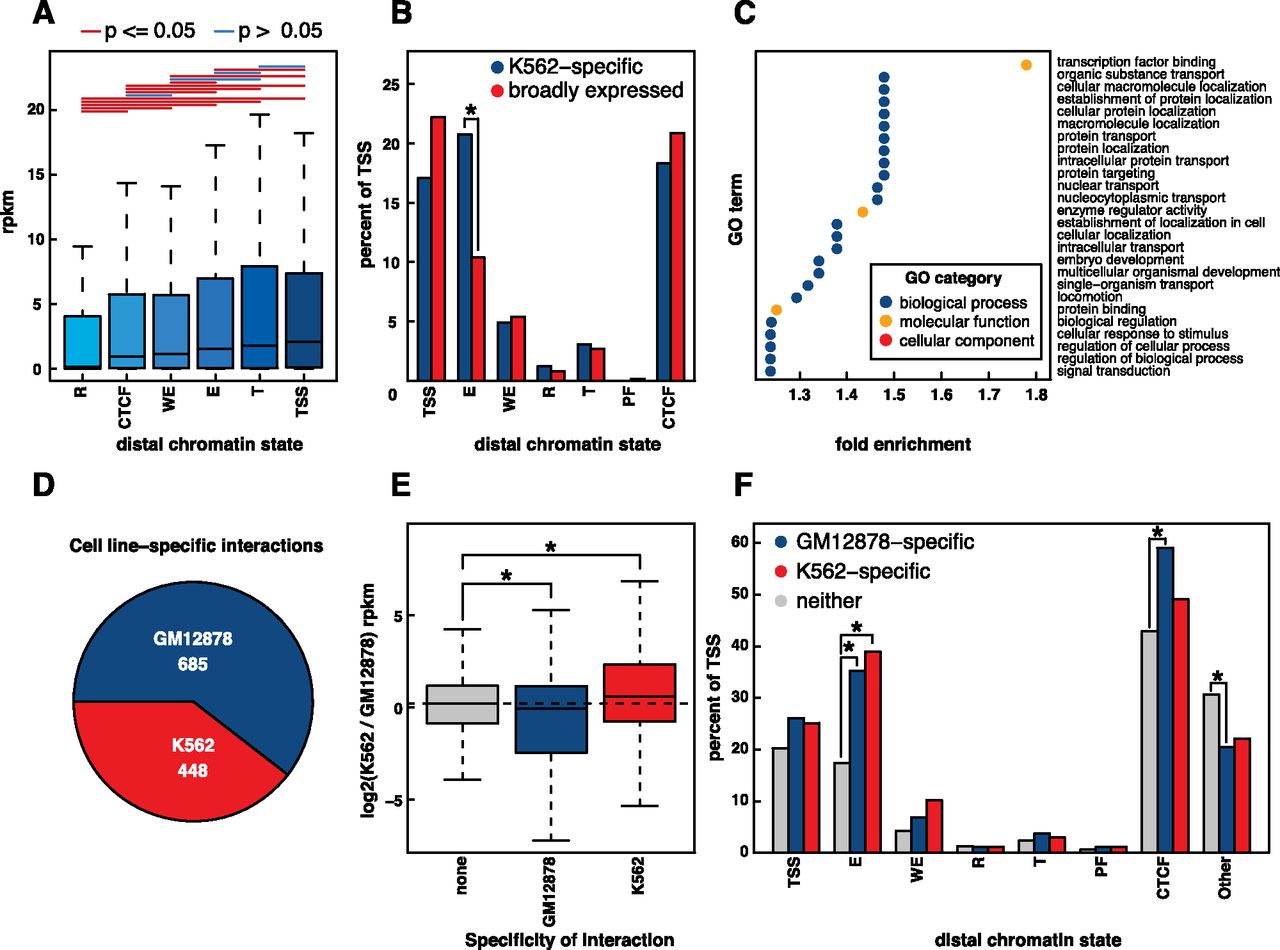
Promoter interactions. (A) Box and whisker plot depicting gene expression (RPKM) as a function of distal chromatin regions. Comparisons that exhibited significant differences (P < 0.05, Wilcoxon signed-rank test) are indicated by red lines, while those that were not significantly different (P ≥ 0.05, Wilcoxon signed-rank test) are indicated by blue lines. (B) Barplot depicting the percentage of genes whose promotors are involved in an interaction with each type of distal chromatin region. Values are shown for both genes that are K562-specific and genes that are broadly expressed. (*) Significant difference (P < 0.05, Fisher’s exact test). (C) GO terms enriched in sets of genes whose promoters interact with enhancers (P < 0.01, Fisher’s exact test with Benjamini-Hochberg correction, fold-change > 1.2). (D) Differential interactions between GM12878 and K562 (FDR = 0.05). See Supplemental Information. (E) Log2 expression changes between K562 and GM12878 for all genes, genes that overlap the ends of GM12878-specific interactions, and genes that overlap the ends of K562-specific interactions. (*) Significant difference from all genes (P < 0.01, Wilcoxon signed-rank test). (F) Percentage of TSS that interact with at least one of each distal regulatory region. (*) Significant difference from all genes (P < 0.01, Fisher’s exact test).


