
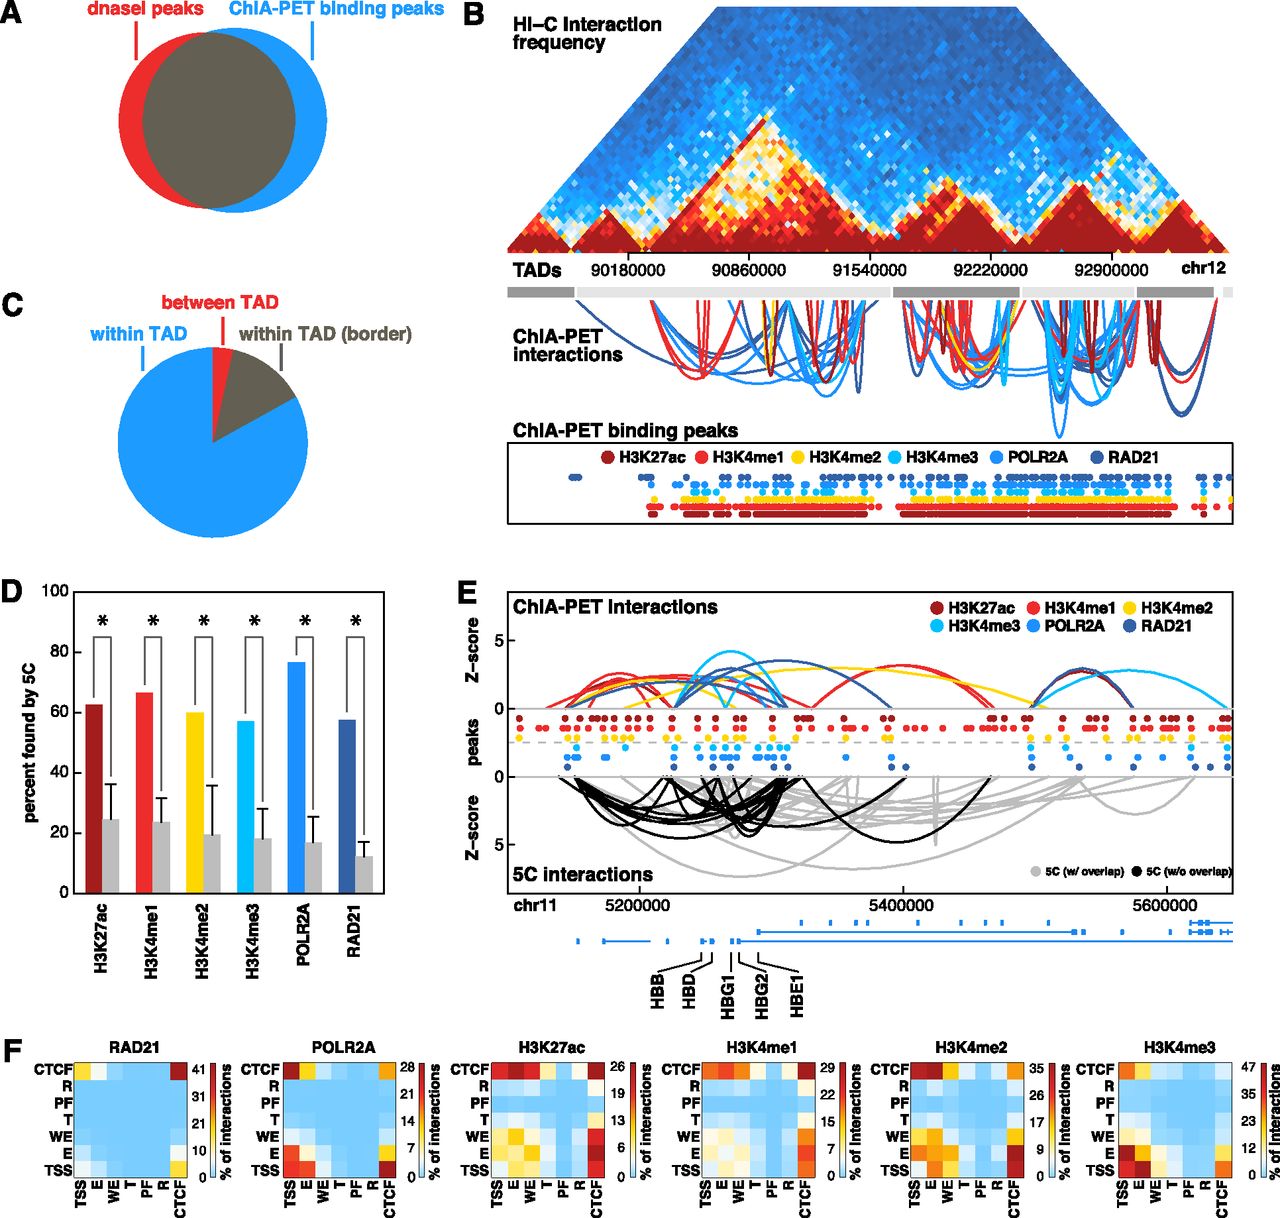
Comparison of ChIA-PET to Hi-C and 5C. (A) Venn diagram depicting overlap between binding peaks detected from ChIA-PET data sets (all six factors combined) and DNase I hypersensitive sites. A total of 80% of DNase I peaks are bound by at least one ChIA-PET peak. (B) Comparison of interactions found by ChIA-PET and Hi-C data sets. Hi-C interaction frequencies for human embryonic stem cells are shown in the top panel. TADs determined by Hi-C are represented by alternating light and dark gray boxes. ChIA-PET interactions are represented by arches. The height of each arch is proportional to the Z-score of each interaction and the color indicates in which data set it was detected. ChIA-PET binding peaks are shown at the bottom. (C) Pie chart depicting the number of ChIA-PET interactions that are completely within one TAD (blue), within one TAD and overlap a TAD border (gray), and between two TADs (red.) TAD borders were defined by extending borders 20 kb in both directions. (D) Percentage of ChIA-PET interactions also found by 5C. Only ChIA-PET interactions that were tested by 5C were considered. Gray bars represent expected percentages generated by randomly selecting interactions from the tested 5C region while retaining the same distribution of interaction distances. (*) P-value < 0.05 (permutation testing, 1000 permutations). (E) ChIA-PET interactions (top) and 5C interactions (bottom) at the globin locus on chromosome 11. Heights of arches represent Z-scores of interactions. ChIA-PET interactions are colored according to data sets. 5C interactions are colored according to whether or not they overlap a ChIA-PET interaction (black: yes, gray: no). Binding peaks for each data set are represented by colored circles. (F) Heat maps depicting the percentage of interactions from each data set that connect different types of genomic loci.


