
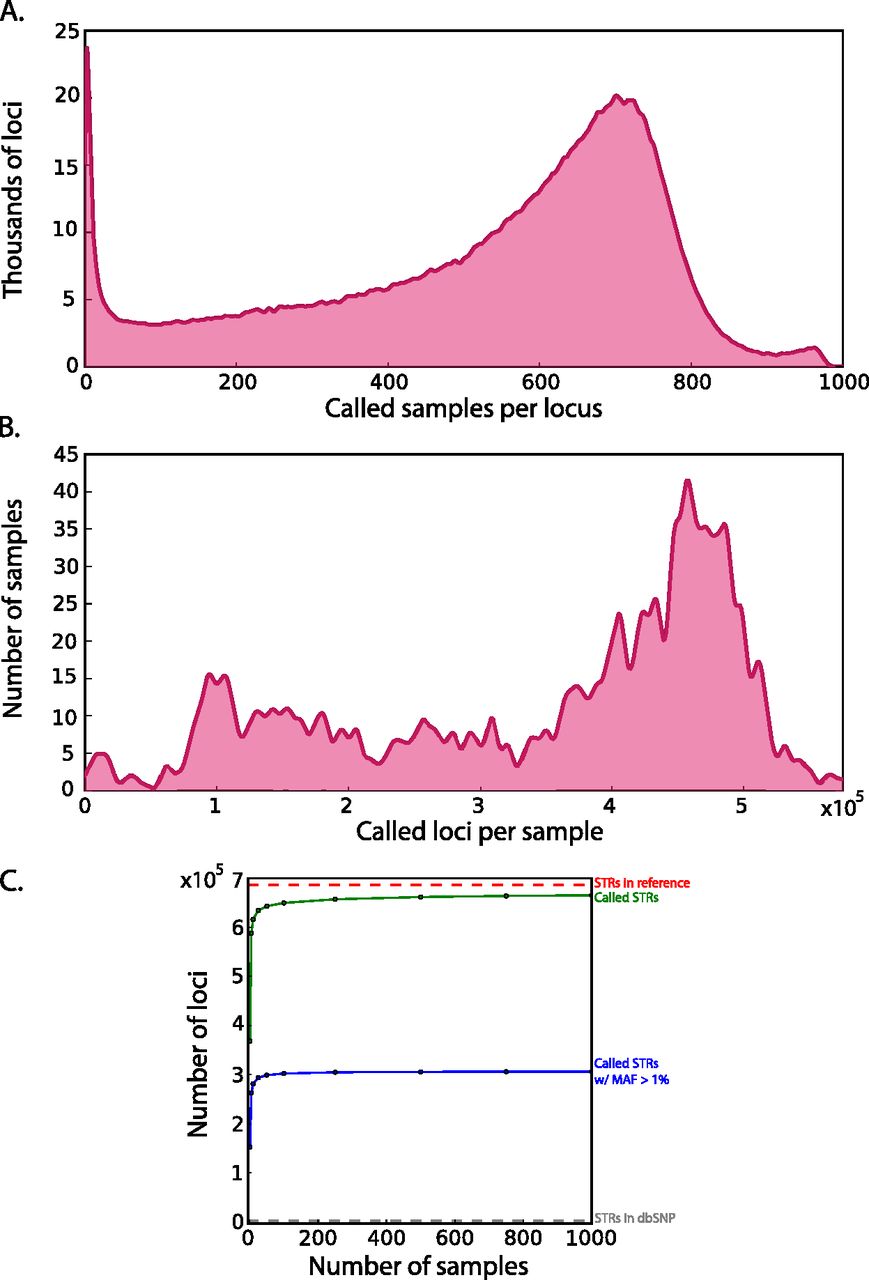
Figure 1.
Call set statistics. (A) Distribution of the number of called samples per locus. The average is 528 samples per STR with a standard deviation of 231. (B) Distribution of the number of called loci per sample. The average is 349,892 STRs per sample with a standard deviation of 145,135. (C) Saturation curves for the catalog. The number of called loci (green) rapidly approaches the total number of STRs in the genome (red line). The number of called loci with a MAF > 1% (blue) saturates after 100 samples and far exceeds the number of STR variants in dbSNP (gray line close to the x-axis).


