
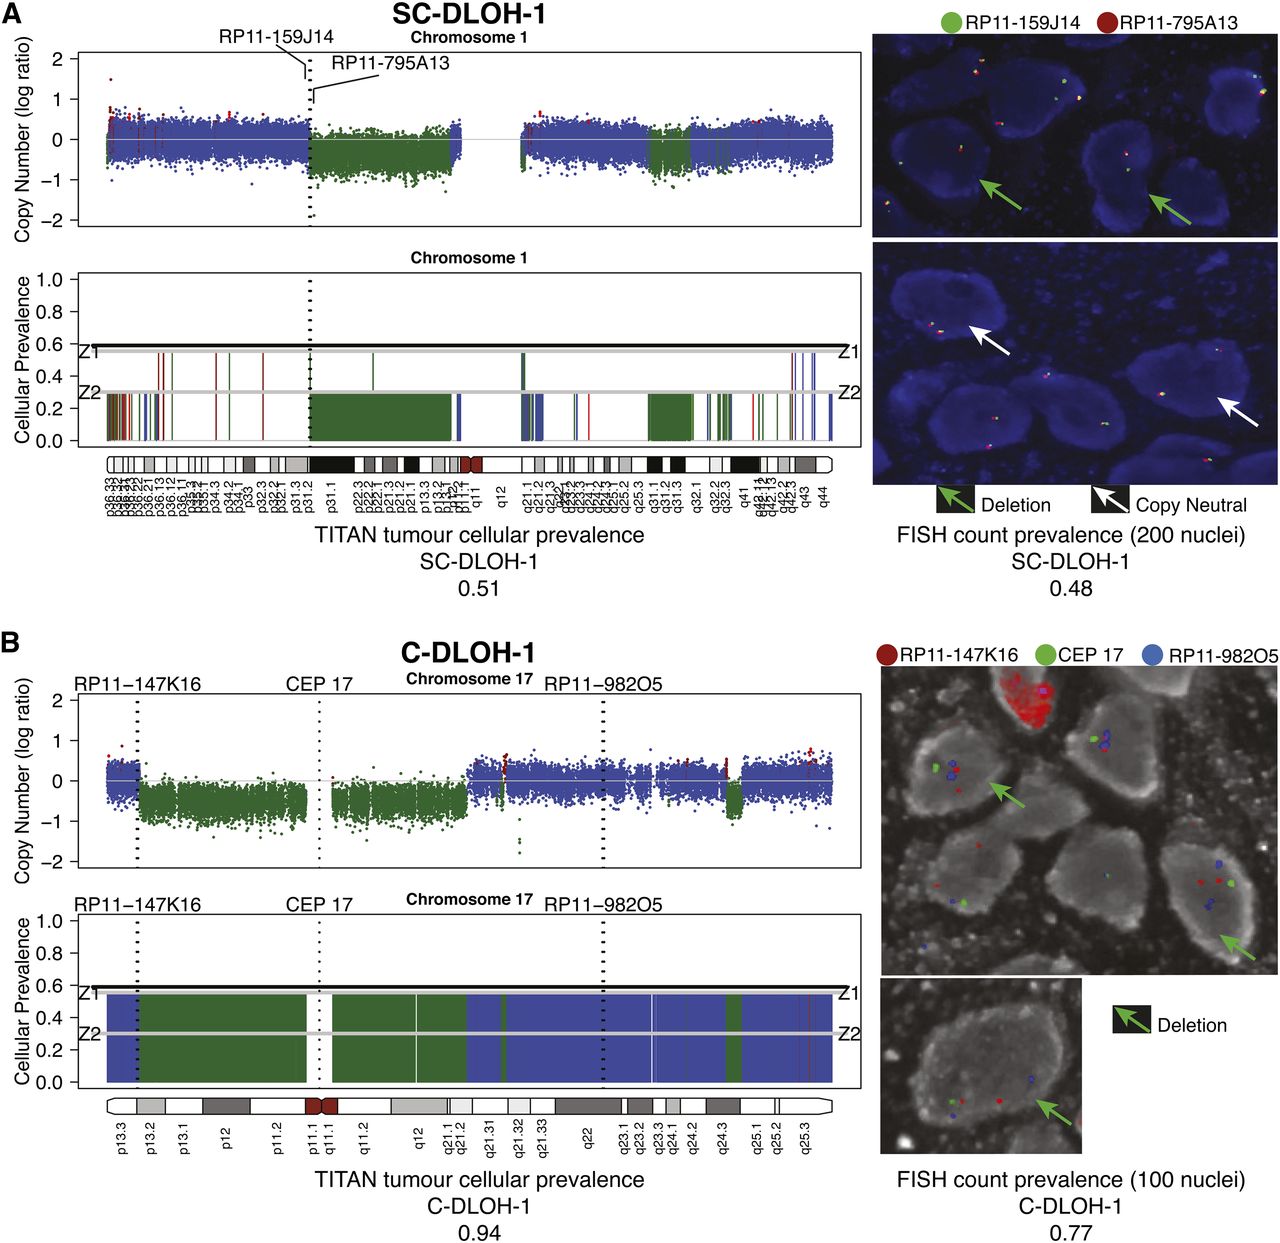
Fluorescence in situ hybridization (FISH) validation of TITAN predictions for Chromosomes 1 and 17 in DG1136g. (A) Subclonal hemizygous deletion, SC-DLOH-1, in Chromosome 1 was validated using BAC probe RP11-795A13 (orange, Chr1:69851036–70025173). Control probe for copy neutral regions was RP11-159J14 (green, Chr1:69454844–69606688). FISH imaging shows tumor cells with a deletion (green arrow) and diploid (white arrow) at this region. (B) Clonal deletion, C-DLOH-1, in Chromosome 17 was validated using the centromeric probe, CEP 17. The BAC probes RP11-147K16 (orange, Chr17:3294803–3452243) and RP11-982O5 (blue, Chr17:55475584–55662513) were used as controls. The majority of cells were observed to harbor the deletion. FISH count prevalence was computed as the proportion of nuclei with event:control count ratio that is <1 (deletion) or >1 (gain) (Supplemental Table 9H). FISH imaging is shown at 63× magnification. Copy number predictions are shown using log ratios (normalized tumor depth/normal depth). Copy neutral (blue), hemizygous deletion (green), and copy gain (red) predictions are shown. Cellular prevalence estimates for clonal cluster 1 (Z1) and cluster 2 (Z2) predicted by TITAN are shown; tumor cellularity is indicated by the black horizontal line.


