
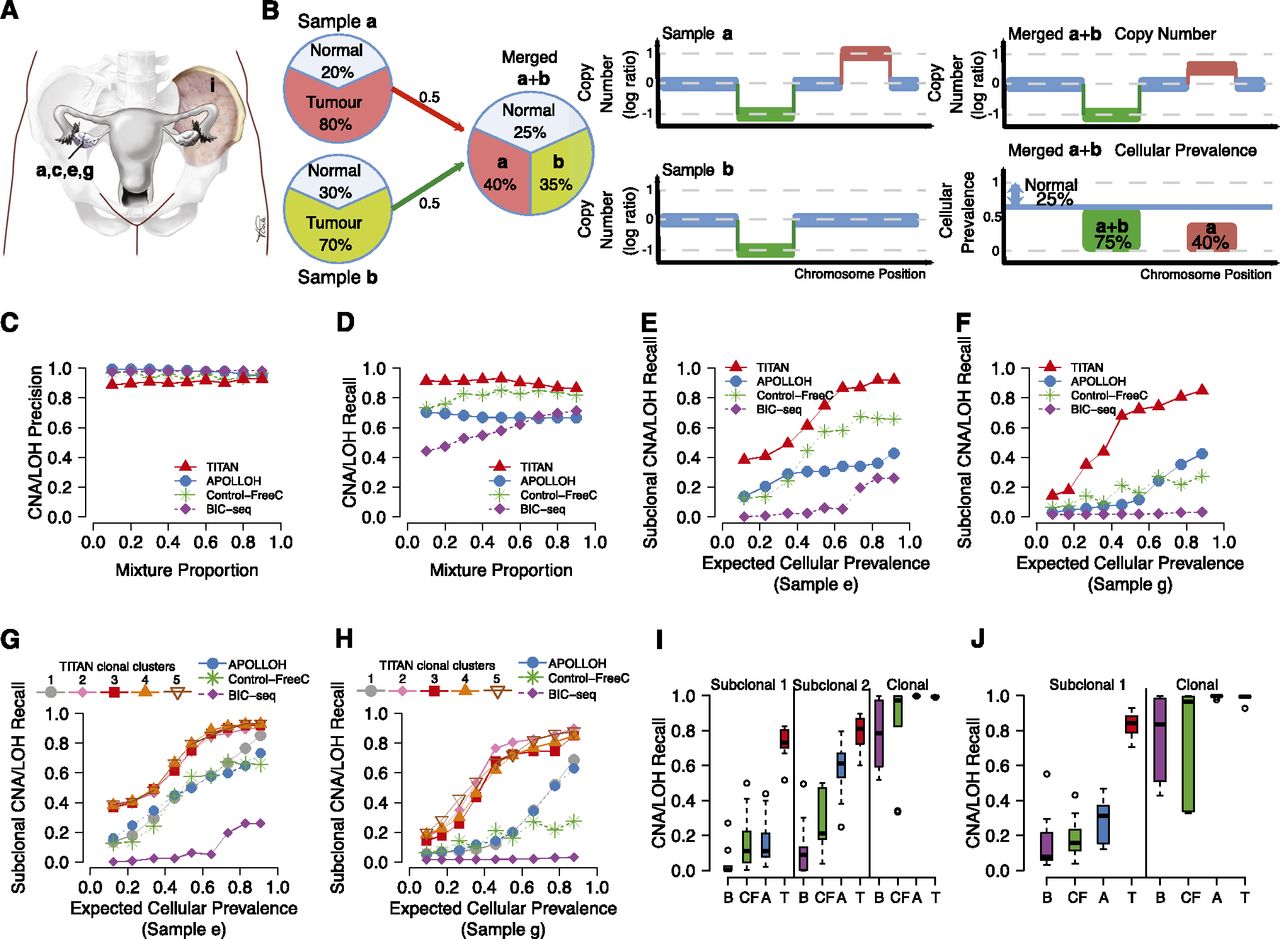
Performance of TITAN in serial and merging simulations using real intratumoral samples from a HGS ovarian carcinoma. (A) Patient DG1136 had biopsies synchronously resected from four sites in the primary tumor of the right ovary and one site from the left pelvic sidewall metastasis. (B) Illustration demonstrating the expected proportions in a simulation of two tumor subpopulations. The tumor content of Sample a (80%) and Sample b (70%) inform the sample cellular prevalence in the merged Sample a + b. Events found in all samples of the mixture represent simulated clonal events. For example, the (green) deletion is present in 75% of the merged sample (or 100% of tumor cells) given that the normal proportion is 25%. Events present in a subset of samples in the mixture simulate subclonal events such as for the (red) gain unique to Sample a which is present in 40% of the merged sample or 53% of the tumor cells. (C–F) Performance of the serial mixture experiment between TITAN, APOLLOH (Ha et al. 2012) (which includes HMMcopy), Control-FREEC (Boeva et al. 2012), and BIC-seq (Xi et al. 2011). The mixture proportion includes 0.1:0.9, 0.2:0.8,…, 0.9:0.1 relative ratios of DG1136e:DG1136g. Precision (C) and recall (D) are shown for subclonal and clonal events averaged across gains, deletions, and LOH events. Recall performance for truth events found uniquely in Sample e (E) or Sample g (F) are shown. “Mixture Proportion” is defined as the ideal mixing fractions (e.g., 10%, 20%, etc.); expected tumor “cellular prevalence” is defined as the expected tumor contribution, at a given mixture proportion, from each individual sample making up the mixture. The expected tumor cellular prevalence shown was computed by adjusting the mixture proportion for tumor content of 67% and 56% for DG1136e and DG1136g, respectively. Ground truth events were identified in the individual samples of the mixture using APOLLOH/HMMcopy, and expected tumor cellular prevalence values are shown in Supplemental Table 3B. (G,H) Serial mixture performance for TITAN runs initialized with number of clusters ranging from one to five. Recall performance for events found uniquely in DG1136e (G) or DG1136g (H) represent events that are subclonal within the simulated mixture. Average recall across deletions, gains, and LOH events are shown. The one-cluster run represents the scenario in which only one tumor population exists. (I,J) Comparison of recall performance distributions across 10 paired (I) and 10 triplet (J) merging simulations for TITAN (T), APOLLOH/HMMcopy (A), and Control-FREEC (CF). Performance is shown for simulated subclonal events, which were present uniquely in exactly one (Subclonal 1) and exactly two (Subclonal 2) samples making up the mixture; and in contrast, clonally dominant events were present in all samples of the mixture (Clonal).


