
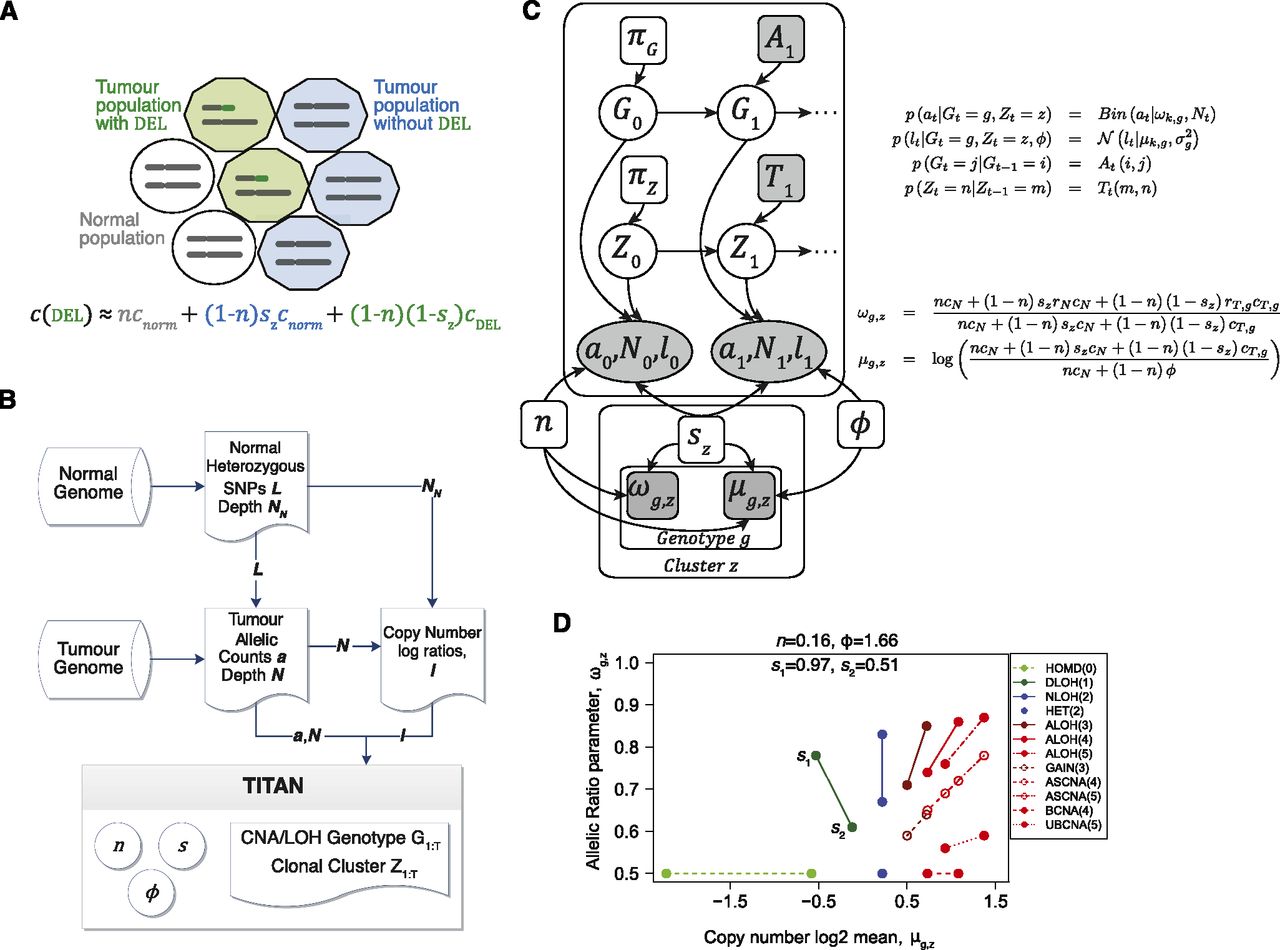
Description of the TITAN probabilistic framework. (A) Representation of the aggregate copy number signal from mixed populations in a heterogeneous tumor sample. c is the aggregate signal that is composed of three components: normal population (white circles), tumor populations with the deletion (green decagons) and without the event (blue decagons). n is the normal proportion; sz is the tumor proportion for the zth clonal cluster that does not contain the event; cnorm and cDEL are normal and tumor copy numbers. Therefore, (1 − sz) corresponds to the proportion of tumor harboring the event, also defined as the tumor cellular prevalence of the zth clonal cluster. (B) Analysis workflow for TITAN. Three inputs are required: (1) Heterozygous positions identified in the normal DNA predicted by genotyping tools such as SAMtools mpileup (Li et al. 2009); (2) reference counts a and read depth N are extracted at these positions from aligned reads in the tumor DNA sequence data; and (3) the tumor and normal read depths, N and NN, are normalized independently to correct GC content and mappability biases; log ratios l = log(N/NN) of the corrected read counts are computed. The output is the optimal sequence of CNA/LOH genotypes and clonal cluster memberships at each position. Model parameters for normal contamination n, tumor cellular prevalence sz, and tumor ploidy φ are estimated. (C) Probabilistic graphical model of TITAN. Shaded nodes are known or observed quantities; open nodes are random variables of unknown quantities. Arrows represent conditional dependence between random variables. Full details and definitions are in Methods and Supplemental Table 13. (D) Parameter trace of ωg,z and μg,z when cellular prevalence varies. s1 and s2 are shown as the tumor cellular prevalence (i.e., transformed using 1 − sz). n is normal proportion and φ is average tumor ploidy. Each CNA/LOH genotype is shown (Supplemental Table 14) with the associated integer copy number in parentheses.


