
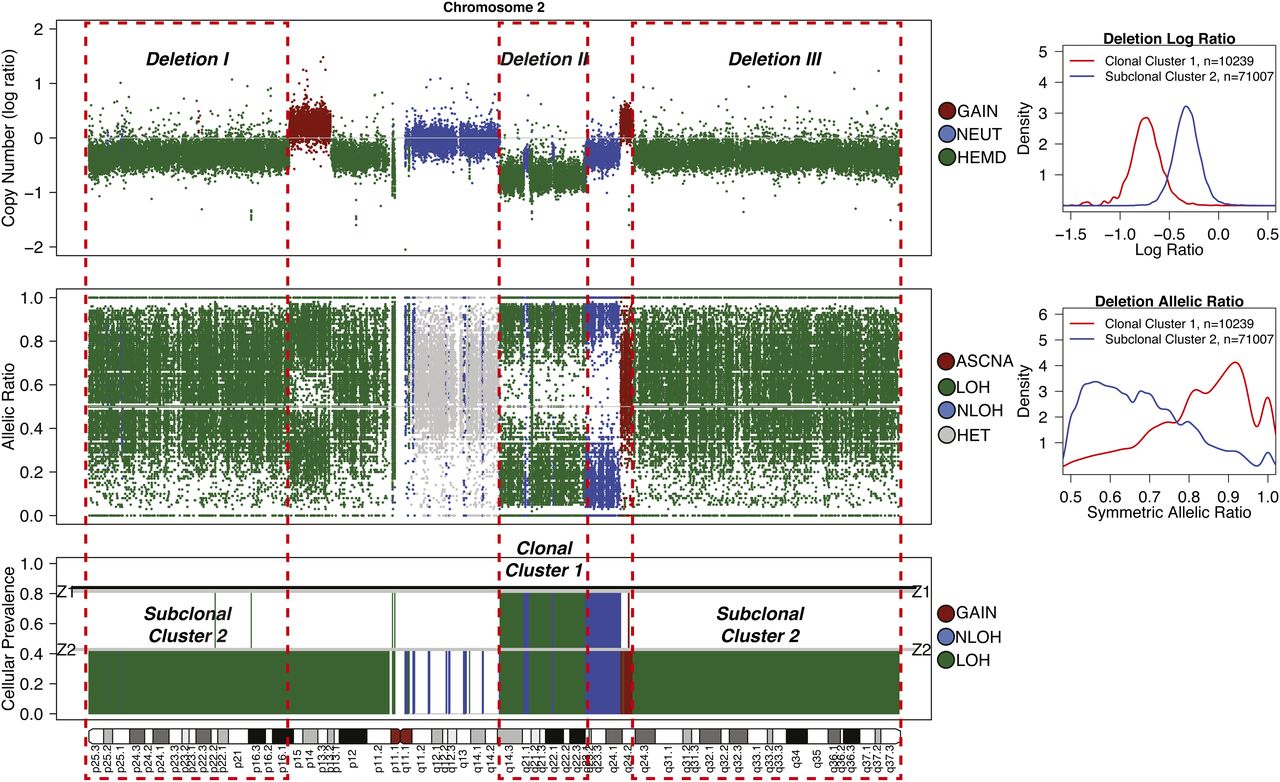
Detection of subclonal deletions in whole-genome sequencing data of a triple negative breast cancer genome. Copy number is represented as the log ratio of tumor and normal read depth. Discrete copy number status shown is predicted as a hemizygous deletion (HEMD; green), copy neutral (NEUT; blue), or gain/amplification (AMP; red). Allelic ratios are computed as the proportion of reads matching the reference genome. The LOH status shown is heterozygous (HET; gray), LOH (green), copy neutral LOH (NLOH; blue), or allele-specific gain/amplification (ASCNA; red). Subclonal deletions are observed to have a weaker log ratio signal that is closer to zero and shows less spreading in allelic ratios (Deletion I) compared to clonal deletions (Deletion II); the sample cellular prevalence estimates (proportion of sample) for “Deletion I” indicate it is in a subclonal cluster “Z2.” “Deletion I” and “Deletion III” are clustered into the same subclonal cluster because they share similar signals, and therefore the same cellular prevalence in the data. “Deletion II” is present in all tumor cells, indicated by being in the clonal cluster “Z1.” Tumor cellularity of 84% (normal contamination of 16%) is denoted with a black horizontal line. The average tumor ploidy (haploid coverage factor) was estimated as 1.66 by genome-wide analysis (right). The log ratio and symmetric allelic ratio (max(reference reads, variant reads)/depth) for Gaussian kernel densities are shown for all deletions on Chr 2.


