
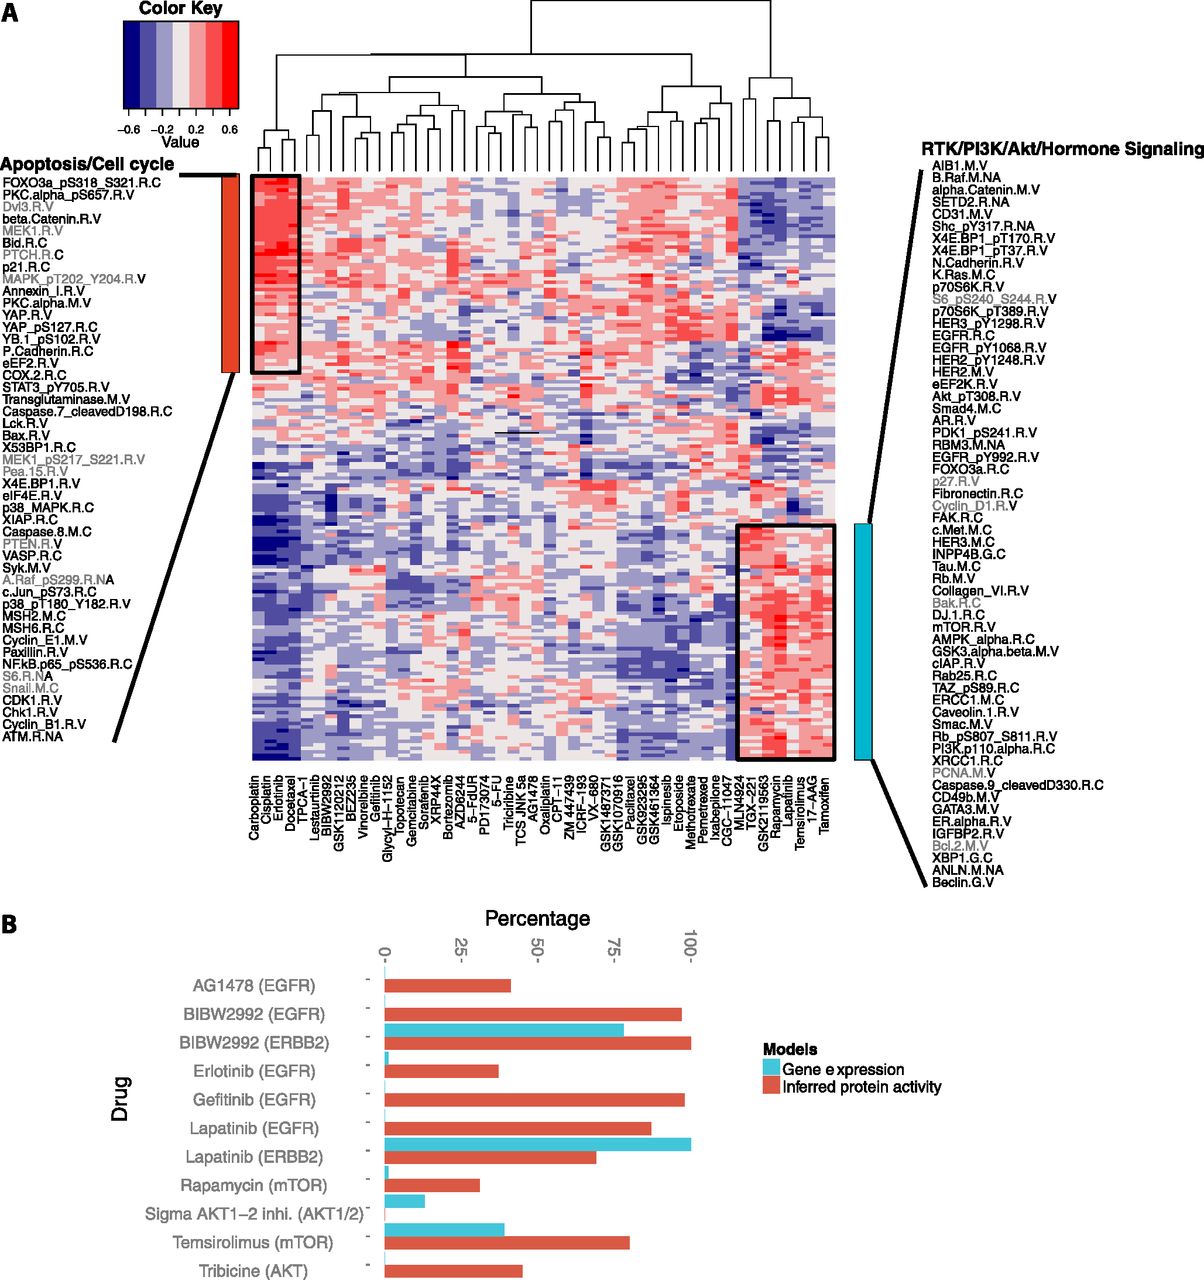
TGCA affinity regression model infers signaling activity in breast cancer cell lines and predicts drug sensitivity. (A) Heatmap revealing correlations between inferred protein activities of cell lines (rows) and drug responses (columns). We identified two clusters of drugs from unsupervised analysis: a group consisting mostly of cytotoxic drugs including carboplatin, cisplatin, and docetaxel, but also erlotinib (EGFR); and a group of targeted therapies including tamoxifen (ESR1), 17-AAG (HSP90), temsirolimus (mTOR), rapamycin (mTOR), lapatinib (EGFR, ERBB2), and GSK2119563 (PIK3CA). (B) Elastic net drug response models built from inferred protein activity reveal drug targets (shown in parentheses after drug name) more often than models built using gene expression.


