
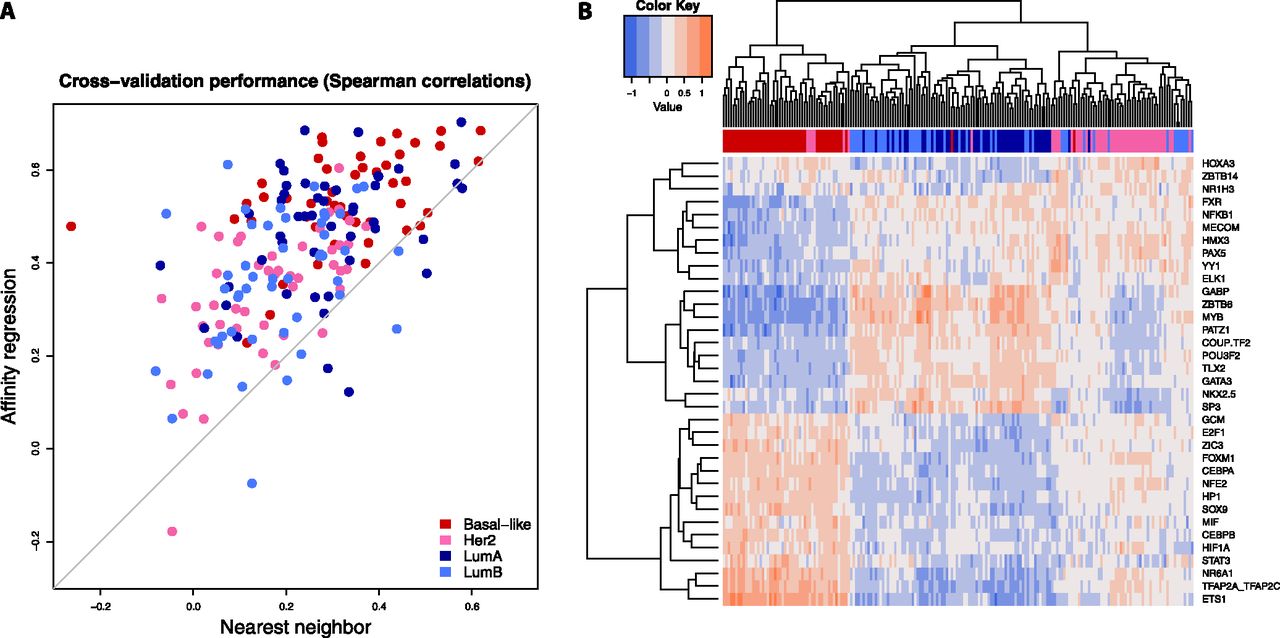
Affinity regression accurately predicts relative gene expression on held-out TCGA breast cancer samples. (A) Plot showing Spearman correlations between predicted and actual gene expression changes relative to a median reference using the affinity regression model (y-axis) and nearest neighbor (x-axis) for TCGA samples representing four breast cancer subtypes (Basal-like, HER2, LumA, LumB). (B) Unsupervised hierarchical clustering of tumors based on inferred TF activities recovers Basal-like, HER2, and Luminal (LumA and LumB) subtypes. The clustering was performed using all TFs (see Supplemental Fig. S3), but for readability, only the features with the largest standard deviation across samples are shown in the heatmap.


