
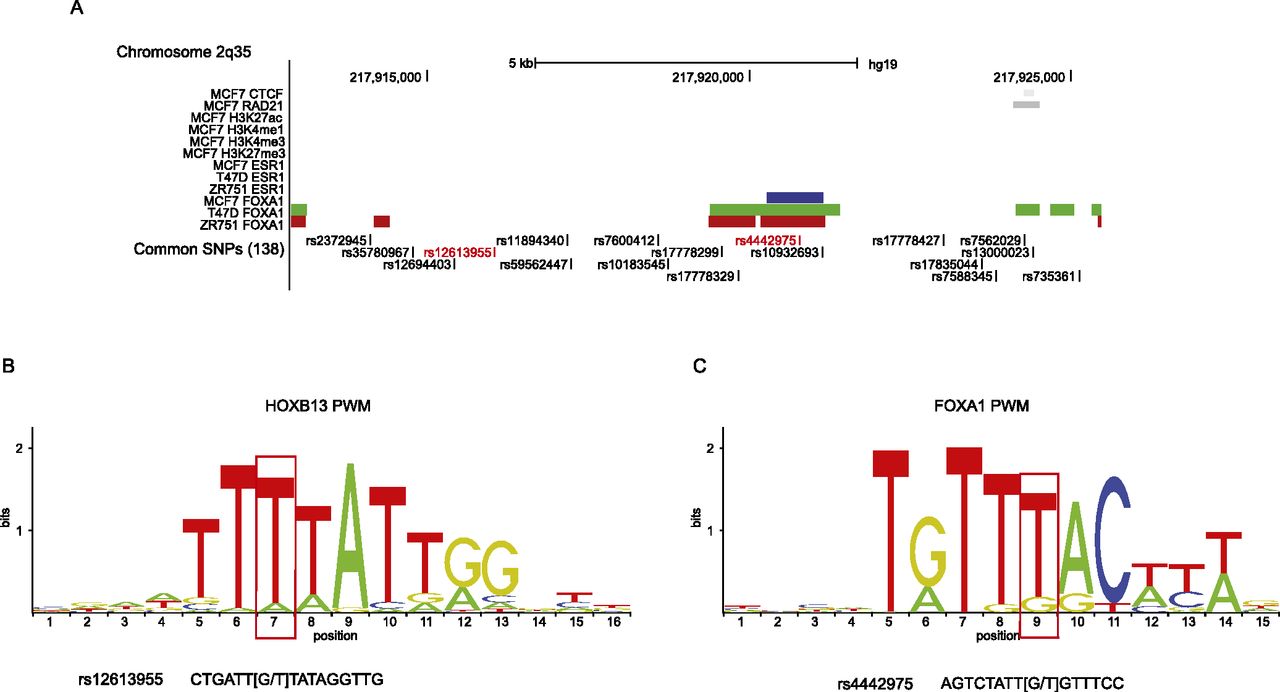
Functional annotation of bait fragment 82 at the 2q35 capture region. (A) The locations of all SNPs that are correlated (r2 ≥ 0.1) with the published risk SNP (rs13387042) are shown, with the two SNPs that are strongly correlated (r2 ≥ 0.8) in red. SNPs are aligned with CTCF and RAD21 binding sites, active (H3K27ac, H3K4me1, and H3K4me3) and repressive (H3K27me3) histone modification marks (in black) generated in the breast cancer cell line MCF7 by the ENCODE Project and by Frietze et al. (2012), and ESR1 and FOXA1 binding peaks generated in MCF7 (blue), T-47D (green), and ZR75-1 cells (red) by Hurtado et al. (2011). All three breast cancer cell lines are homozygous for the G-allele of rs4442975. (B) Position weighted matrix (PWM) for HOXB13 binding site. The base position that is altered by rs12613955 is indicated by a red box and the sequence of rs12613955 is shown below. Based on ChIP-seq data in (human) prostate cancer cells (Huang et al. 2014), the consensus sequence is conserved between mouse and man. (C) PWM for FOXA1 binding site with the base position that is altered by rs4442975 indicated by a red box and the sequence of rs4442975 shown below.


